ETFOptimize | High-performance ETF-based Investment Strategies

Quantitative strategies, Wall Street-caliber research, and insightful market analysis since 1998.


ETFOptimize | HOME
Close Window

How Is Ecolab's Stock Performance Compared to Other Basic Material Stocks?

Valued at a market cap of $86.9 billion, Ecolab Inc. (ECL) is a Saint Paul, Minnesota-based company that provides water, hygiene, and infection prevention solutions and services. 

Companies valued at $10 billion or more are typically classified as “large-cap stocks,” and Ecolab fits the label perfectly, with its market cap exceeding this threshold, underscoring its size, influence, and dominance within the specialty chemicals industry. The company’s strengths lie in its global scale, long-term client relationships, regulatory expertise, and data-driven technologies that help customers improve operational efficiency, reduce water and energy usage, and maintain high safety and sustainability standards. 


This hygiene and infection prevention solutions provider is currently trading marginally below its 52-week high of $309.27, reached on Feb. 24. Shares of ECL have rallied 12.1% over the past three months, lagging behind the iShares U.S. Basic Materials ETF’s (IYM26.8% rise during the same time frame.

www.barchart.com Moreover, on a YTD bas

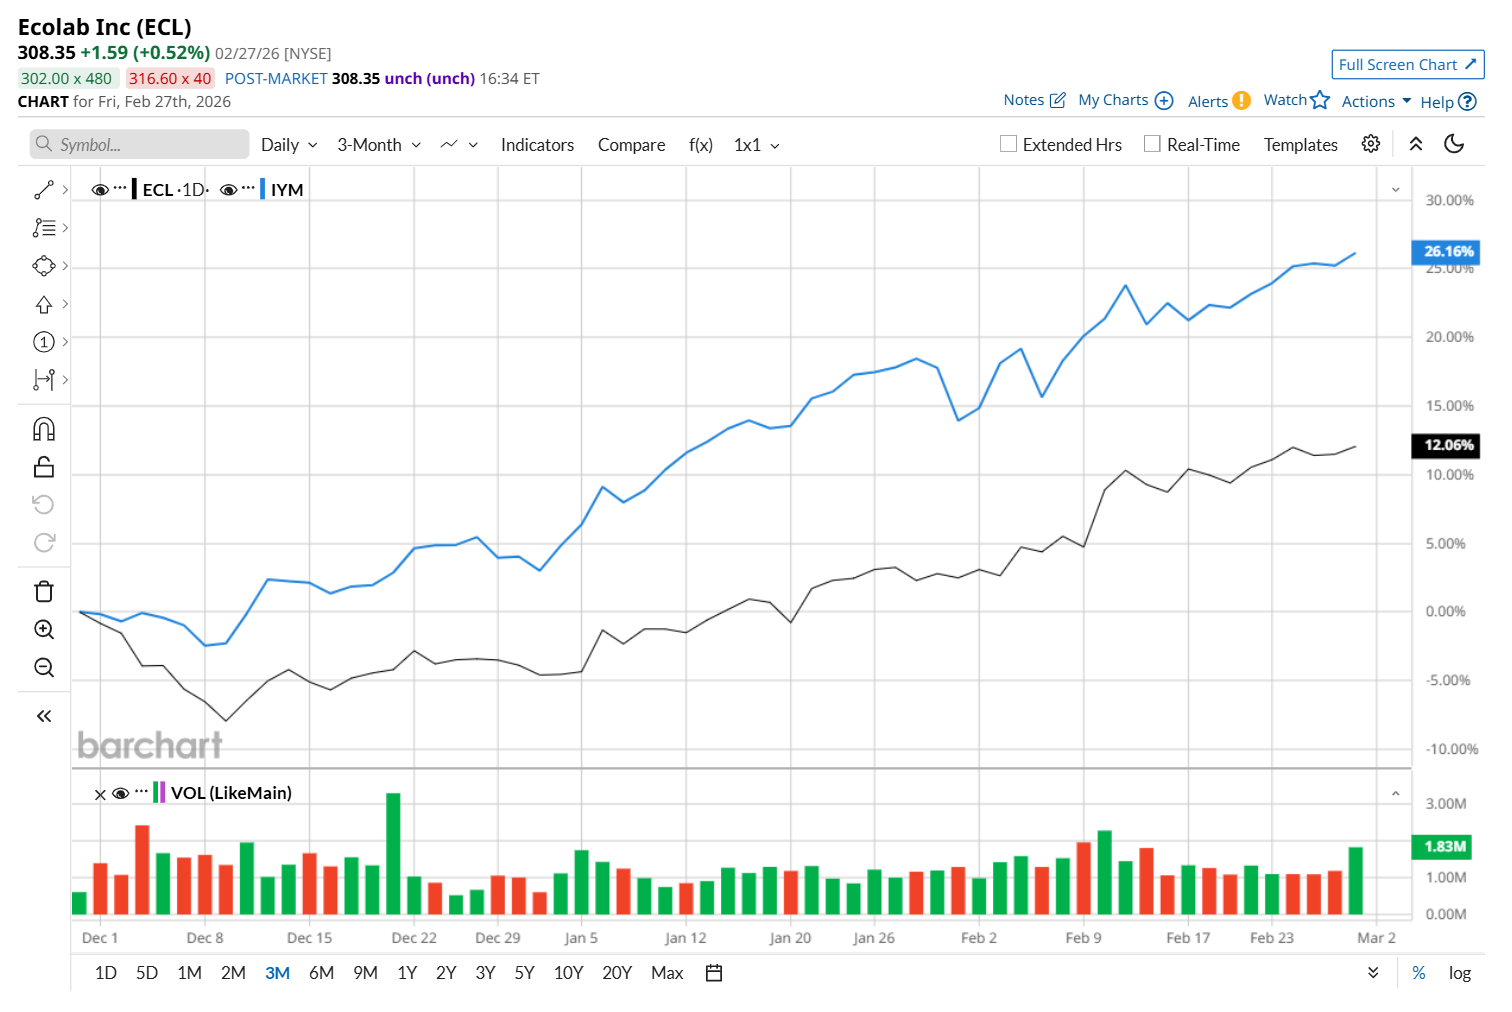
Moreover, on a YTD basis, shares of ECL are up 17.5%, compared to IYM’s 22.5% rise. In the longer term, ECL has gained 15.4% over the past 52 weeks, trailing behind IYM’s 37.6% uptick over the same time frame. 

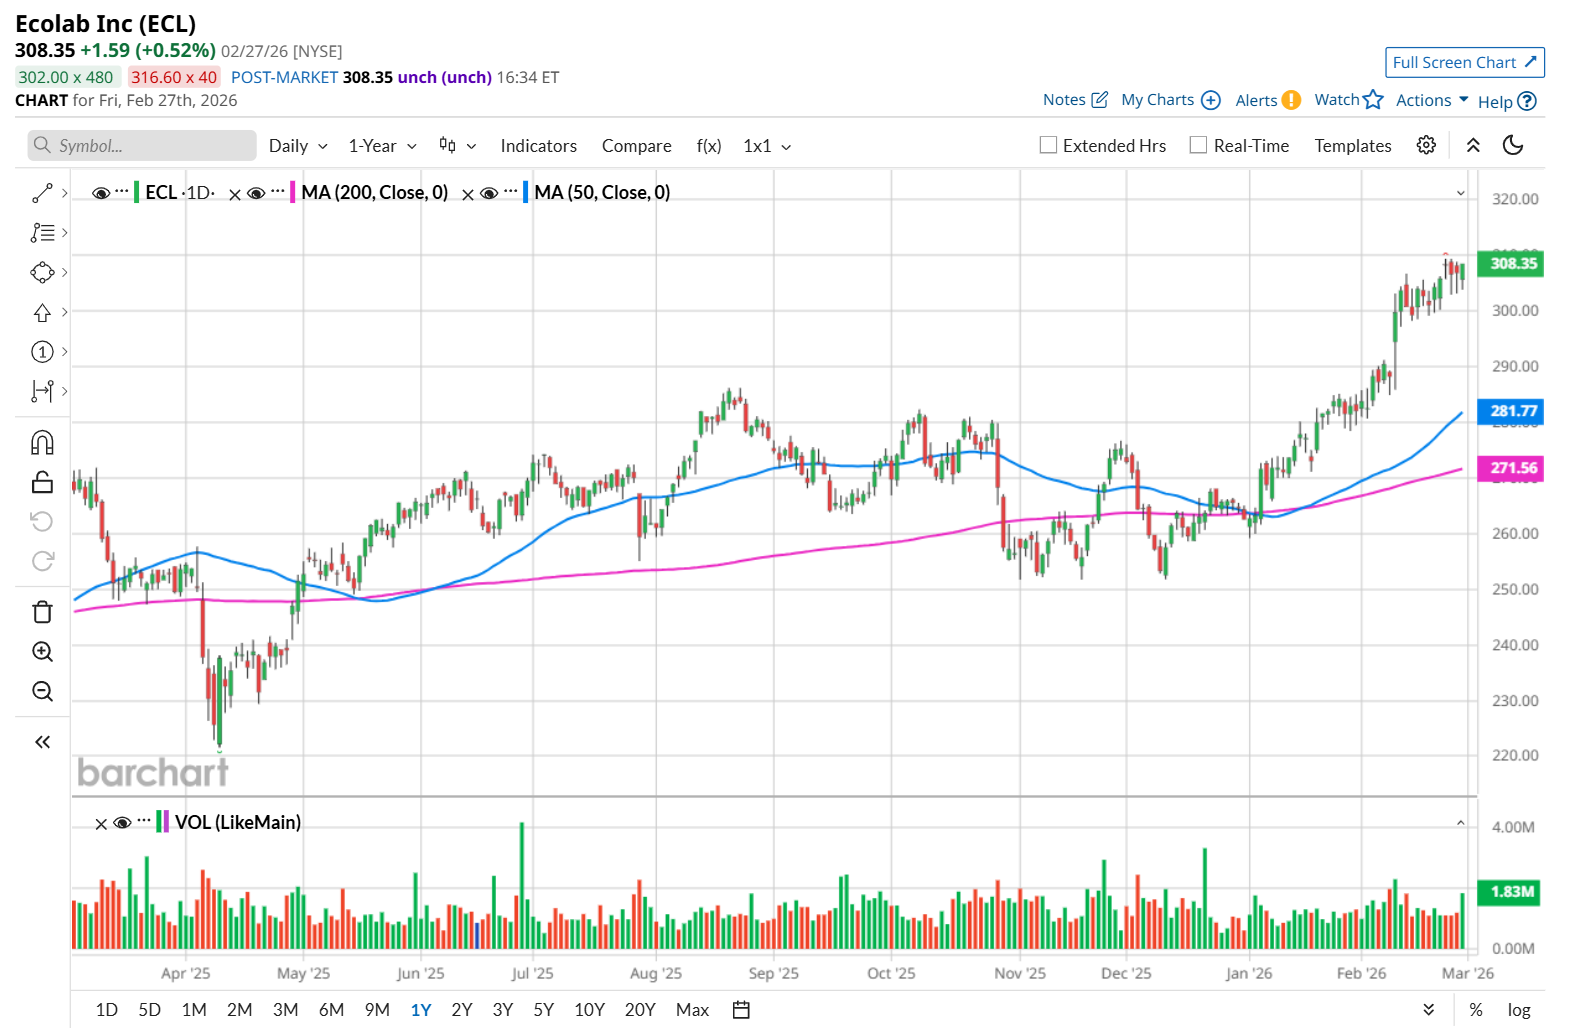
To confirm its bullish trend, ECL has been trading above its 200-day and 50-day moving averages since early January. 

www.barchart.com 

On Feb. 10, shares of ECL soared 4% after its better-than-expected Q4 earnings release. The company's total revenue increased 4.8% year-over-year to $4.2 billion, surpassing consensus estimates by a slight margin. Moreover, its adjusted EPS of $2.08 improved 14.9% from the same period last year, topping analyst expectations of $2.06. The company is currently hitting all-time highs in early 2026, largely due to its defensive business model. Hospitals, hotels, and food plants need their sanitation services regardless of whether the economy is booming or slowing down.

ECL has also underperformed its rival, DuPont de Nemours, Inc. (DD), which soared 47.8% over the past 52 weeks and 24.5% on a YTD basis. 

Despite Ecolab’s recent underperformance, analysts remain moderately optimistic about its prospects. The stock has a consensus rating of "Moderate Buy” from the 28 analysts covering it, and the mean price target of $323.52 suggests a 4.9% premium to its current price levels. 


On the date of publication, Neharika Jain did not have (either directly or indirectly) positions in any of the securities mentioned in this article. All information and data in this article is solely for informational purposes. For more information please view the Barchart Disclosure Policy here.

Recent Quotes

View More
Symbol Price Change (%)
AMZN  213.49
+0.00 (0.00%)
AAPL  259.88
+0.00 (0.00%)
AMD  202.68
+0.00 (0.00%)
BAC  47.90
+0.00 (0.00%)
GOOG  306.01
+0.00 (0.00%)
META  647.39
+0.00 (0.00%)
MSFT  409.41
+0.00 (0.00%)
NVDA  182.65
+0.00 (0.00%)
ORCL  151.56
+0.00 (0.00%)
TSLA  398.68
+0.00 (0.00%)
Stock Quote API & Stock News API supplied by www.cloudquote.io
Quotes delayed at least 20 minutes.
By accessing this page, you agree to the Privacy Policy and Terms Of Service.


IntelligentValue Home
Close Window

DISCLAIMER

All content herein is issued solely for informational purposes and is not to be construed as an offer to sell or the solicitation of an offer to buy, nor should it be interpreted as a recommendation to buy, hold or sell (short or otherwise) any security.  All opinions, analyses, and information included herein are based on sources believed to be reliable, but no representation or warranty of any kind, expressed or implied, is made including but not limited to any representation or warranty concerning accuracy, completeness, correctness, timeliness or appropriateness. We undertake no obligation to update such opinions, analysis or information. You should independently verify all information contained on this website. Some information is based on analysis of past performance or hypothetical performance results, which have inherent limitations. We make no representation that any particular equity or strategy will or is likely to achieve profits or losses similar to those shown. Shareholders, employees, writers, contractors, and affiliates associated with ETFOptimize.com may have ownership positions in the securities that are mentioned. If you are not sure if ETFs, algorithmic investing, or a particular investment is right for you, you are urged to consult with a Registered Investment Advisor (RIA). Neither this website nor anyone associated with producing its content are Registered Investment Advisors, and no attempt is made herein to substitute for personalized, professional investment advice. Neither ETFOptimize.com, Global Alpha Investments, Inc., nor its employees, service providers, associates, or affiliates are responsible for any investment losses you may incur as a result of using the information provided herein. Remember that past investment returns may not be indicative of future returns.

Copyright © 1998-2017 ETFOptimize.com, a publication of Optimized Investments, Inc. All rights reserved.