Nucor Corporation (NUE) stands as the largest steel producer and recycler in the United States. Headquartered in Charlotte, North Carolina, the company operates across steel mills, steel products, and raw materials, manufacturing everything from sheet and structural steel to finished components such as joists, girders, and tubing. Unlike traditional blast-furnace steelmakers, Nucor relies on a scrap-based electric arc furnace (EAF) model, a production approach that offers greater operational flexibility while being comparatively more environmentally efficient.
With a market capitalization of $37.2 billion, NUE firmly sits in the large-cap category, reflecting its scale, industry influence, and leadership within the U.S. steel sector. Backed by vertically integrated operations and a diversified product portfolio, the company supplies key materials to industries including construction, infrastructure, manufacturing, and energy, reinforcing its position as a resilient and efficient steel industry powerhouse.
Despite its strong fundamentals, NUE’s stock has cooled slightly after hitting a 52-week high of $196.90 on Feb. 11 and is currently trading 17% below the peak. Over the past three months, NUE stock has plunged 1%, outperforming the Dow Jones Industrial Average’s ($DOWI) 3.9% decline during the same time frame.
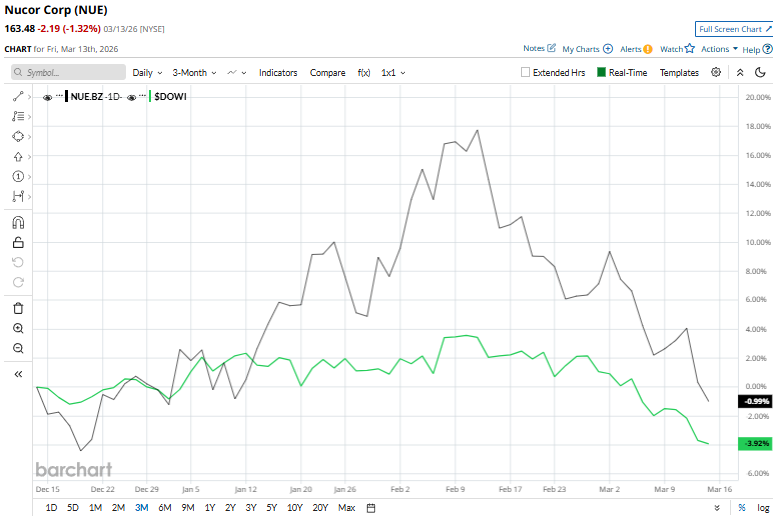
Looking at the broader trend, Nucor’s momentum remains solid. The stock has gained 15.7% over the past six months, far ahead of the Dow’s 1.6% return, and it has surged 26.2% over the past year, significantly beating the index’s 14.1% gain.
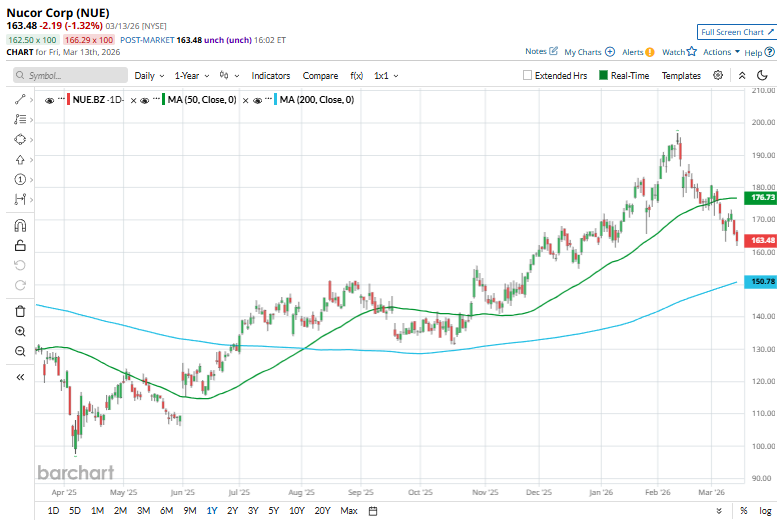
From a technical standpoint, NUE has traded above its 200-day moving average since July 2025, signaling a longer-term bullish trend. However, it recently dipped below its 50-day moving average, suggesting near-term pressure.
On Feb. 20, 2026, Nucor’s board declared a regular quarterly cash dividend of $0.56 per share, payable on May 11, 2026, to shareholders of record as of March 31, 2026, marking the company’s 212th consecutive quarterly dividend. In addition, the board approved a new $4 billion share repurchase program, replacing the previous authorization from May 2023 under which about $3.69 billion of stock had already been repurchased.
NUE’s top rival, Steel Dynamics, Inc. (STLD) shares have taken the lead over Nucor, with a 30.6% rise on a six-month basis and 38.4% gains over the past 52 weeks.
Nevertheless, Wall Street analysts are very bullish on NUE’s prospects. The stock has a consensus “Strong Buy” rating from the 15 analysts covering it. The mean price target of $190.23 implies an upswing potential of 16.4% from the current market prices.
On the date of publication, Kritika Sarmah did not have (either directly or indirectly) positions in any of the securities mentioned in this article. All information and data in this article is solely for informational purposes. For more information please view the Barchart Disclosure Policy here.
More news from Barchart