Valued at a market cap of $12.1 billion, Align Technology, Inc. (ALGN) is a medical device leader headquartered in Tempe, Arizona, that pioneered the digital transformation of orthodontics through its flagship Invisalign system. It operates an integrated "Align Digital Platform" that combines advanced 3D software, mass-customized manufacturing, and proprietary materials to treat misaligned teeth without traditional metal braces.
Companies valued at $10 billion or more are typically classified as “large-cap stocks,” and ALGN fits the label perfectly, with its market cap exceeding this threshold, underscoring its size, influence, and dominance within the medical instruments & supplies industry. The company has treated over 22 million patients worldwide and continues to expand its ecosystem through iTero intraoral scanners and exocad CAD/CAM software, which provide dentists and orthodontists with a seamless end-to-end digital workflow for restorative and orthodontic care.
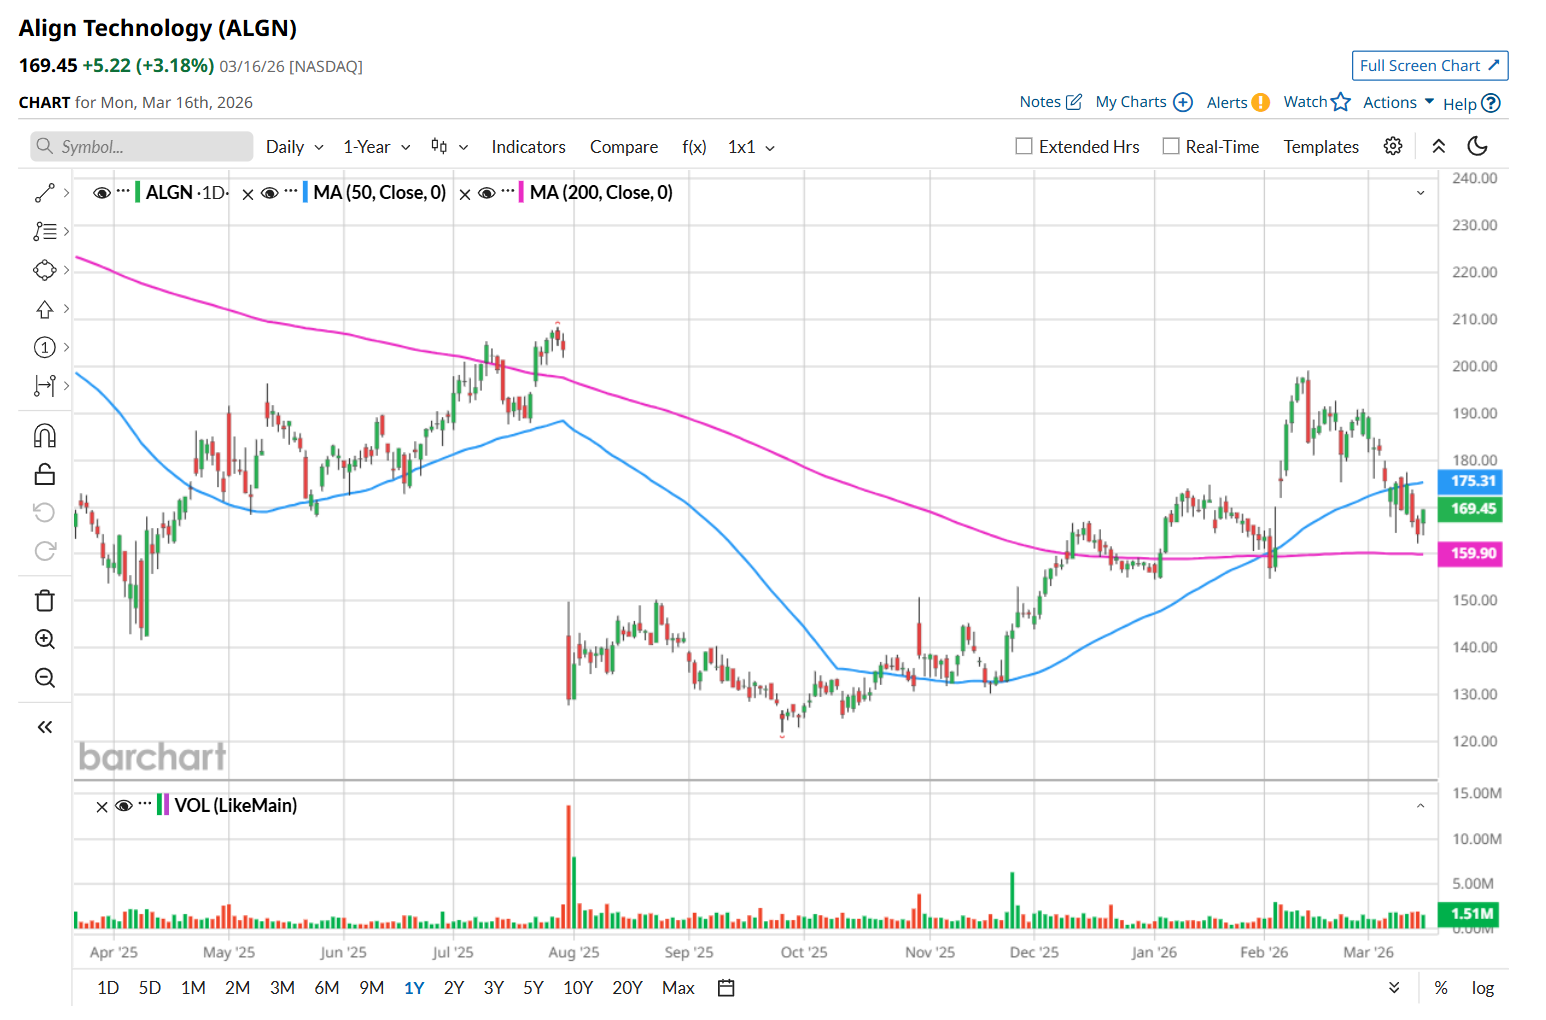
This dental care leader is currently trading 18.7% below its 52-week high of $208.31, reached on Jul. 29, 2025. Shares of ALGN have soared 4% over the past three months, outperforming the Nasdaq Composite’s ($NASX) 3.2% drop during the same time frame.
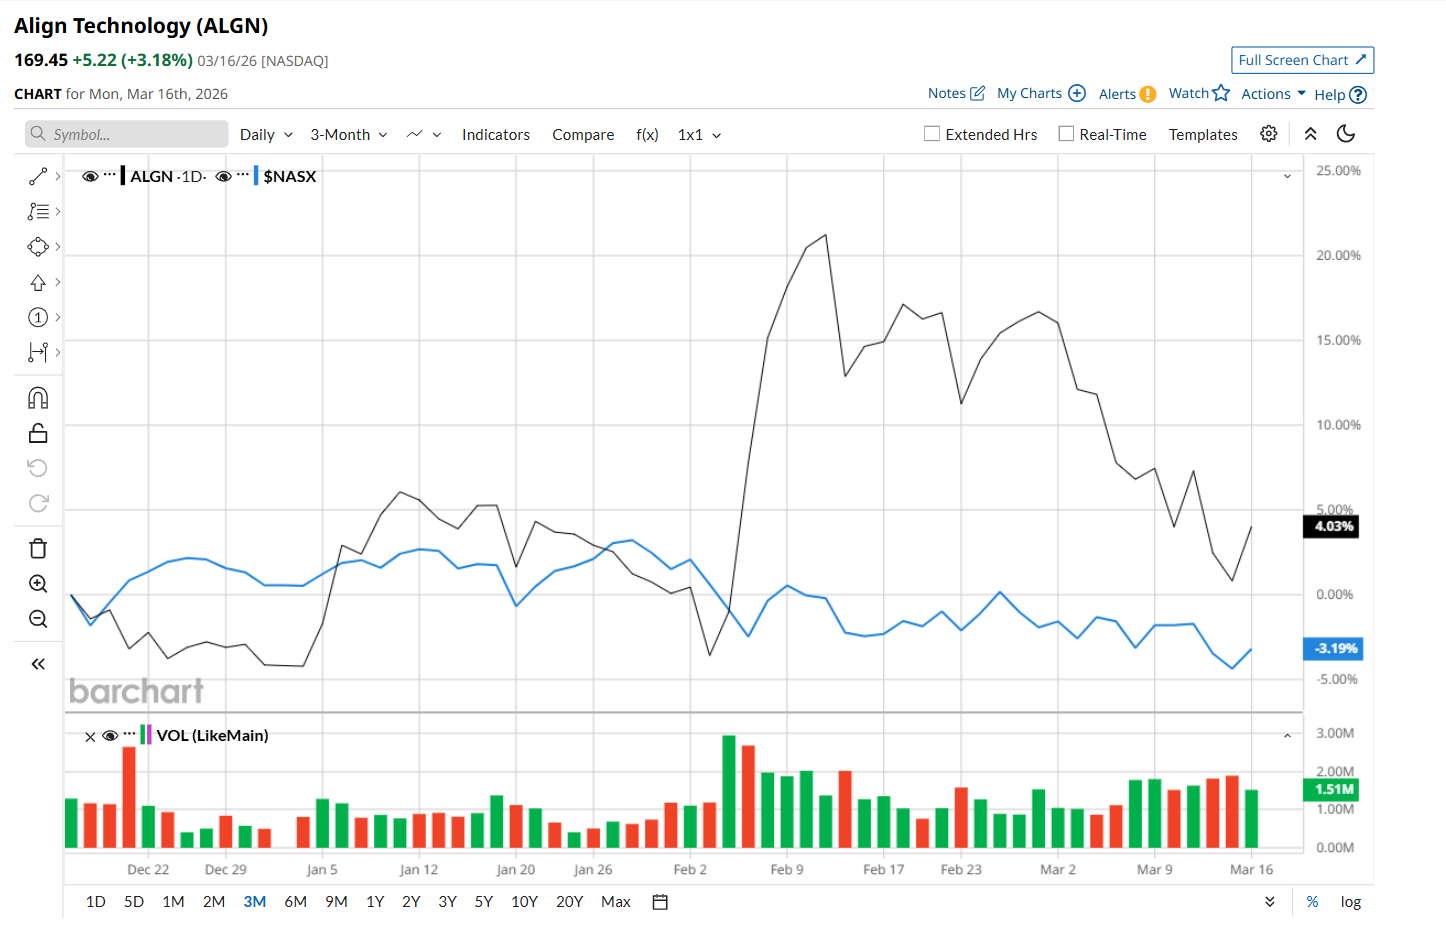
Moreover, on a YTD basis, shares of ALGN are up 8.5%, compared to NASX’s 3.7% fall. However, in the longer term, ALGN has gained 2% over the past 52 weeks, trailing NASX’s 26% uptick over the same time frame.
To confirm its bullish trend, ALGN has been trading above its 200-day moving average since early January, with slight fluctuations. However, it has started trading below its 50-day moving average since early March.
After ALGN reported its Q4 results on Feb. 4, investor sentiment improved noticeably. The stock gained 2.7% on the day of the announcement and continued its upward trend, rising another 8.9% and 6.8% over the following two sessions. Its revenue came in at $1.05 billion, reflecting a 5.3% year-over-year increase and slightly beating analyst expectations of $1.03 billion. Meanwhile, its adjusted EPS climbed 34.8% to $3.29, comfortably ahead of the $2.97 consensus estimate. The strong performance was mainly supported by continued traction in dental service organizations (DSOs) and solid demand for clear aligners.
ALGN has considerably outperformed its rival, DENTSPLY SIRONA Inc. (XRAY), which declined 24.6% over the past 52 weeks and gained 2.6% on a YTD basis.
Given ALGN’s recent outperformance, analysts remain moderately optimistic about its prospects. The stock has a consensus rating of "Moderate Buy” from the 15 analysts covering it, and the mean price target of $200.15 suggests an 18.1% premium to its current price levels.
On the date of publication, Neharika Jain did not have (either directly or indirectly) positions in any of the securities mentioned in this article. All information and data in this article is solely for informational purposes. For more information please view the Barchart Disclosure Policy here.
More news from Barchart