Valued at a market cap of $292.1 billion, Lam Research Corporation (LRCX) is a leading U.S. semiconductor equipment manufacturer that designs and produces wafer fabrication equipment used in the production of integrated circuits. Headquartered in Fremont, California, Lam specializes in critical process steps, especially etch and deposition, used by advanced logic and memory chipmakers worldwide.
Companies valued at $200 billion or more are typically classified as “mega-cap stocks,” and LRCX fits the label perfectly, with its market cap exceeding this threshold, underscoring its size, influence, and dominance within the semiconductor equipment & materials industry.
Lam Research’s core competencies center on advanced etch and precision deposition technologies that enable the fabrication of increasingly complex semiconductor structures, particularly in 3D NAND memory and leading-edge logic devices. Its deep process co-development with top chipmakers embeds Lam tools in yield-critical manufacturing steps, creating high switching costs and durable pricing power. A large global installed base further strengthens its position through recurring services, upgrades, and optimization revenue.
This tech giant is currently trading 8.9% below its 52-week high of $256.68, recorded recently on Feb. 25. Shares of LRCX have rallied 50.8% over the past three months, considerably outpacing the State Street SPDR S&P Semiconductor ETF (XSD), which has gained 11.1% in the same time frame.
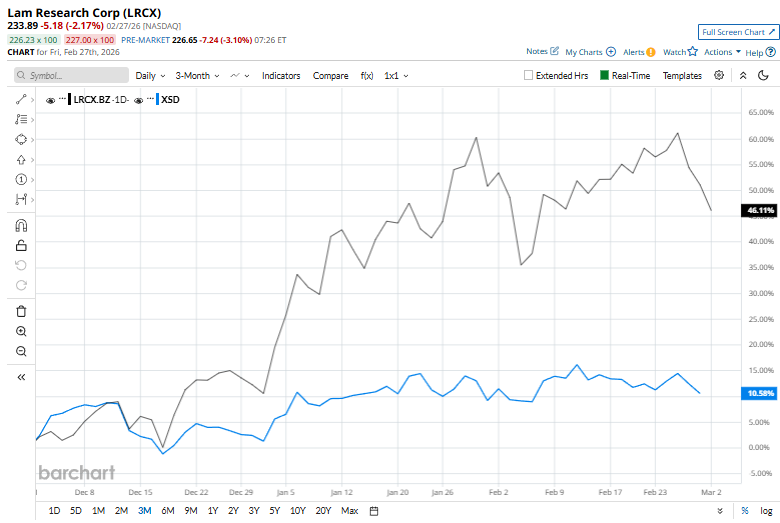
Lam Research has delivered a stunning momentum run, with its shares surging 125.6% in just six months, dramatically outpacing XSD’s 21.6% gain. The longer-term picture is even more striking as LRCX has rocketed 207.1% over the past year, nearly quadrupling the ETF’s 57.9% advance.
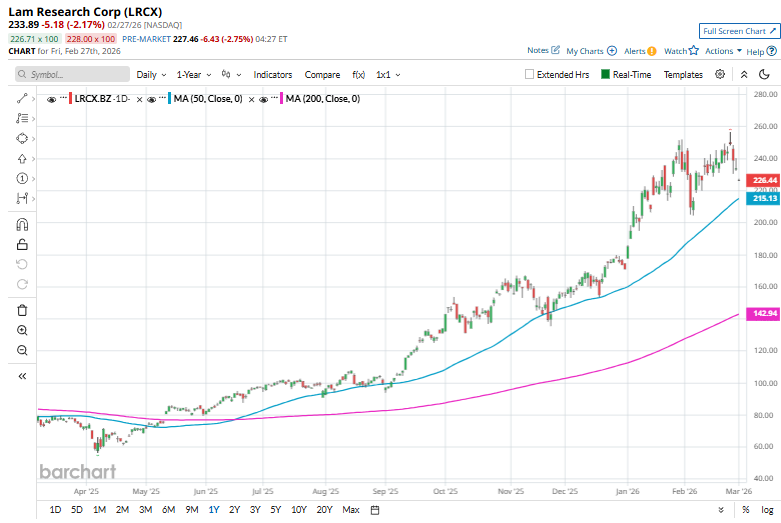
Technically, the rally remains well-supported. Lam has traded consistently above both its 50-day and 200-day moving averages since early May, signaling sustained bullish control despite minor pullbacks.
On Feb. 26, Lam Research shares declined 5.2% in afternoon trading as the semiconductor sector broadly sold off following a classic “buy-the-rumor, sell-the-news” reaction to NVIDIA Corporation’s (NVDA) earnings. The move reflected shifting investor focus from near-term AI strength to concerns about rising competition and the sustainability of heavy AI spending.
LRCX has also considerably outpaced its rival, Applied Materials, Inc. (AMAT), which soared 137.7% over the past 52 weeks and has slightly lagged AMAT’s 126.5% rally over the past six months.
Given LRCX’s recent outperformance, analysts remain moderately optimistic about its prospects. The stock has a consensus rating of "Strong Buy” from the 32 analysts covering it, and the mean price target of $279.69 suggests a 19.6% premium to its current price levels.
On the date of publication, Kritika Sarmah did not have (either directly or indirectly) positions in any of the securities mentioned in this article. All information and data in this article is solely for informational purposes. For more information please view the Barchart Disclosure Policy here.
More news from Barchart


