Equinix, Inc. (EQIX), headquartered in Redwood City, California, operates as a real estate investment trust. With a market cap of $95.7 billion, the company invests in interconnected data centers. Equinix focuses on developing network and cloud-neutral data center platform for cloud and information technology, enterprises, network, and mobile services providers, as well as for financial companies.
Companies worth $10 billion or more are generally described as “large-cap stocks.” EQIX effortlessly fits that bill, with its market cap exceeding this mark, underscoring its size, influence, and dominance within the specialty REIT industry.Equinix's vast global network of 250+ data centers in 71 markets creates a powerful "network effect", where each new customer adds value for existing ones, fostering a thriving digital marketplace. This expansive platform, spanning 33 countries and a vibrant partner ecosystem, drives customer growth and bookings, giving Equinix a significant competitive edge.
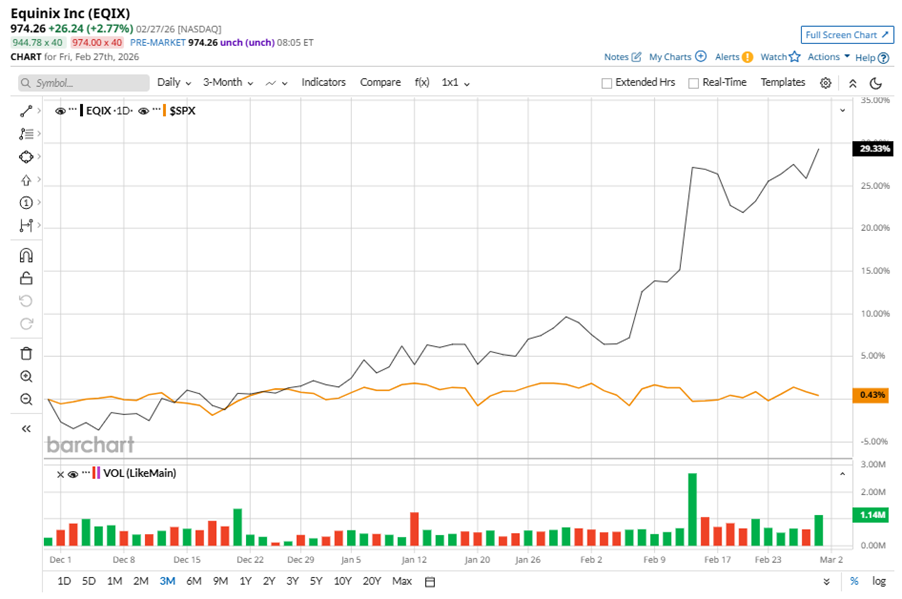
Despite its notable strength, EQIX slipped 1.9% from its 52-week high of $992.90, achieved on Feb. 12. Over the past three months, EQIX stock has gained 29.8%, outperforming the S&P 500 Index’s ($SPX) 1% gain during the same time frame.
Shares of EQIX rose 27.2% on a YTD basis, outperforming SPX’s YTD marginal gains. However, in the longer term, the stock climbed 7% over the past 52 weeks, underperforming SPX’s 17.4% returns over the last year.
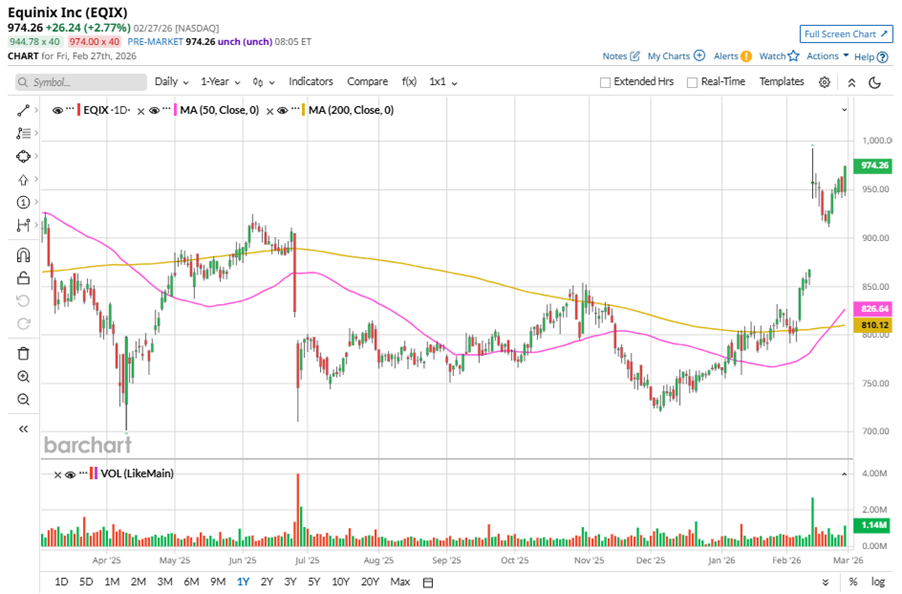
To confirm the bullish trend, EQIX has been trading above its 50-day moving average since early January, with a slight fluctuation. The stock is trading above its 200-day moving average since late January, with minor fluctuations.
On Feb. 11, EQIX reported its Q4 results, and its shares closed up more than 10% in the following trading session. Its FFO of $8.91 per share missed Wall Street expectations of $9.07 per share. The company’s revenue was $2.4 billion, missing Wall Street forecasts of $2.5 billion. The company expects full-year FFO in the range of $41.93 to $42.74 per share, and revenue ranging from $10.1 billion to $10.2 billion.
In the competitive arena of specialty REIT, Digital Realty Trust, Inc. (DLR) has lagged behind EQIX, with a 14.5% uptick on a YTD basis, but outpaced the stock with solid 12.7% gains over the past 52 weeks.
Wall Street analysts are bullish on EQIX’s prospects. The stock has a consensus “Strong Buy” rating from the 31 analysts covering it, and the mean price target of $1,019.78 suggests a potential upside of 4.7% from current price levels.
On the date of publication, Neha Panjwani did not have (either directly or indirectly) positions in any of the securities mentioned in this article. All information and data in this article is solely for informational purposes. For more information please view the Barchart Disclosure Policy here.
More news from Barchart


