Freeport-McMoRan Inc. (FCX) is a global mining business that explores, develops, and produces copper, gold, and molybdenum from extensive, long-term operations across different regions. Its portfolio includes significant mining sites in the Americas and Indonesia. The company’s main corporate headquarters is located in Phoenix, Arizona. It has a market capitalization of $97.84 billion, making it a “large-cap” stock.
FCX’s stock reached an all-time high of $69.75 on Feb. 25, but is down 2.4% from that level. The stock has been up 61.5% over the past three months as copper and other metals prices have risen, improving the company’s outlook. Contrarily, the broader Dow Jones Industrial Average ($DOWI) is up 3.3% over the same period. Therefore, the stock has outperformed the wider index over this period.
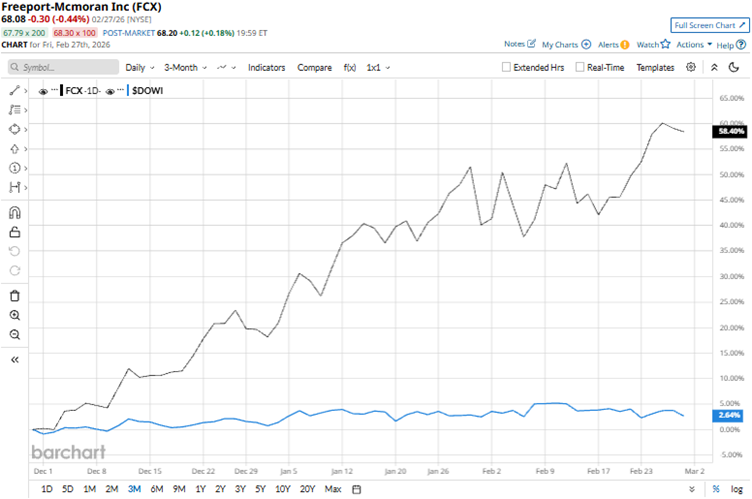
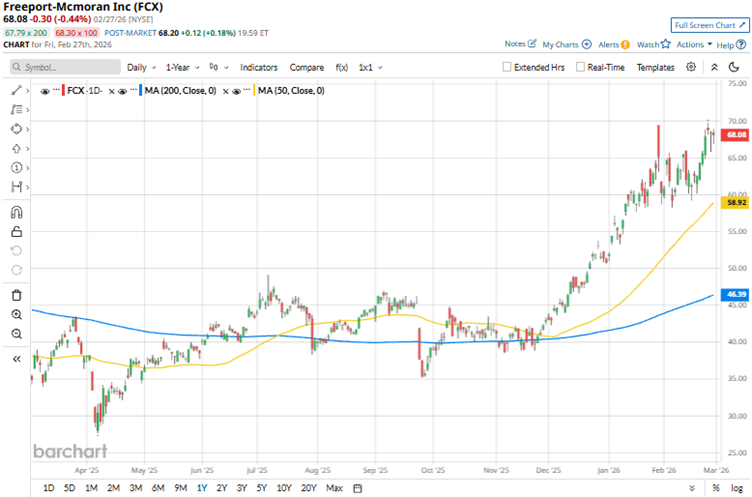
Over the past 52 weeks, the stock has increased 81.9%, while the Dow Jones index is up 13.3%. FCX’s shares have increased 34% year-to-date (YTD), while the index has gained 1.9%. The stock has been trading above its 50-day and 200-day moving averages since late November 2025.
On Jan. 22, FCX reported better-than-expected fourth-quarter results, generating $5.63 billion in revenues and $0.47 in adjusted EPS. The company’s consolidated copper and gold sales were better than what it had earlier expected.
Freeport remains on track for the phased restart of the Grasberg Block Cave underground mine in Indonesia, starting from the second quarter of this year. Last month, FCX announced an MoU with the Indonesian government to extend operating rights for PT Freeport Indonesia (PTFI) for the life of the resource in the Grasberg minerals district.
We compare Freeport-McMoRan’s performance with that of another basic materials stock, Rio Tinto Group (RIO), which has gained 63.6% over the past 52 weeks and 24.1% YTD. Therefore, FCX has been the clear outperformer over these periods.
Wall Street analysts are strongly bullish on Freeport-McMoran’s stock. The stock has a consensus rating of “Strong Buy” from the 21 analysts covering it. The mean price target of $65.71 implies a 3.5% downside from current levels. However, the Street-high price target of $81 indicates a 19% upside.
On the date of publication, Anushka Dutta did not have (either directly or indirectly) positions in any of the securities mentioned in this article. All information and data in this article is solely for informational purposes. For more information please view the Barchart Disclosure Policy here.
More news from Barchart
- ‘Companies Die for Many Reasons’ But ‘Old Age Itself Is Not Lethal’: Can Greg Abel Keep Berkshire’s ‘Youthful’ Energy Alive After Replacing Warren Buffett?
- GE Vernova Stock Trades Near Record High — Lock in Gains or Let It Run?
- As Archer Aviation Enters a Patent War, Should You Buy, Sell, or Hold the Flying Car Stock?
- Option Volatility And Earnings Report For March 2-6


