ETFOptimize | High-performance ETF-based Investment Strategies

Quantitative strategies, Wall Street-caliber research, and insightful market analysis since 1998.


ETFOptimize | HOME
Close Window

Is McKesson Corporation Stock Outperforming the Nasdaq?

Headquartered in Irving, Texas, McKesson Corporation (MCK) stands as one of the most influential players in global healthcare distribution. The company moves pharmaceuticals, medical-surgical supplies, and critical health products across a vast network that links biopharma manufacturers, providers, pharmacies, and ultimately patients.

With a market cap of nearly $120.9 billion, it occupies the “large-cap” arena reserved for companies valued above $10 billion. The scale underscores its dominant position in healthcare distribution and its broad operational reach across domestic and international markets.


MCK stock currently sits at its 52-week high of $987.37, reached in February. Over the past three months, the shares have gained 11.7%, while the Nasdaq Composite ($NASXfell 2.4%, marking clear short-term outperformance against the broader index.

www.barchart.com

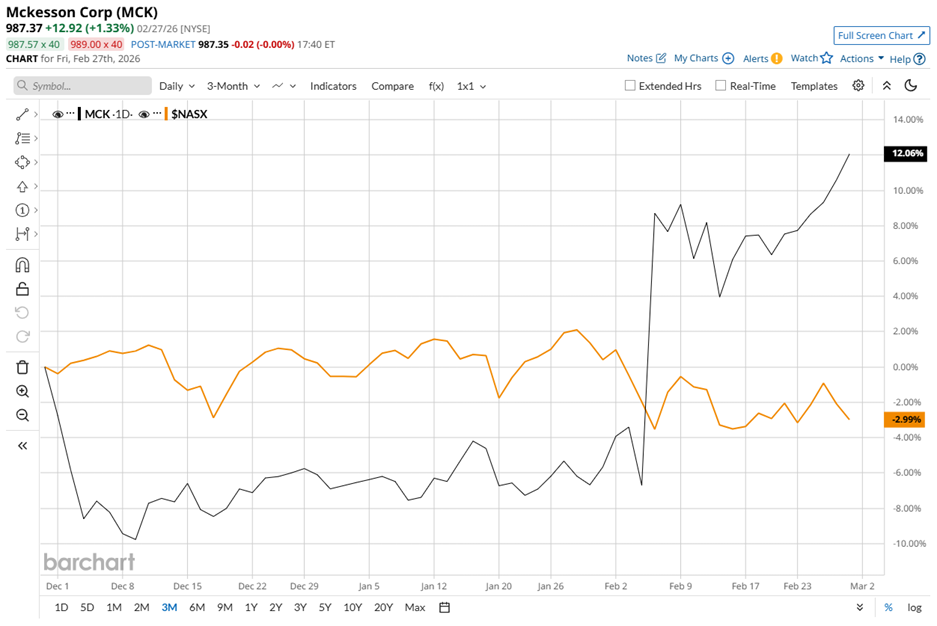
The longer-term trend reinforces the strength. Over the past 52 weeks, MCK stock has surged 59% and remains up 20.4% year-to-date (YTD). During the same 52-week stretch, Nasdaq advanced 22.2% but has declined 2.5% YTD. Across both time horizons, McKesson delivered clear relative outperformance. 

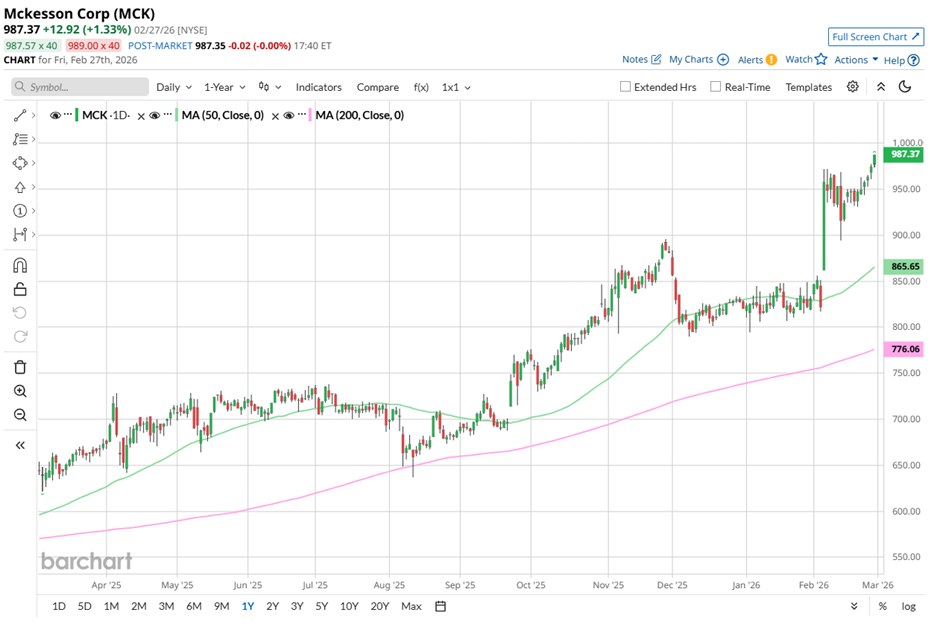
The technical structure supports the narrative. Since February, the stock has been trading above its 50-day moving average of $865.65. It also remains above its 200-day moving average of $776.06 since April 2025. 

www.barchart.com

On Feb. 5, MCK stock climbed 16.5% following the release of fiscal Q3 2026 results a day earlier. During the quarter, revenue reached $106.2 billion, matching analyst expectations and marking an 11.4% year-over-year expansion. Adjusted EPS rose 16.3% to $9.34, surpassing the Street's estimate of $9.27.

Growth stemmed from strong oncology performance, expanding biopharma services, and continued momentum in North American pharmaceutical distribution. Management reinforced that confidence by raising its full-year non-GAAP earnings outlook, projecting 17% to 19% growth compared to the prior year.

To frame McKesson’s performance in context, rival Cencora, Inc. (COR) has gained 49.5% over the past 52 weeks and stands up 10.2% YTD. While Cencora has delivered impressive returns, McKesson has edged ahead on both longer-term and YTD measures. 

Wall Street’s conviction reflects the distinction. MCK stock carries a “Strong Buy” overall rating from 17 analysts. Moreover, it is already trading above its mean price target of $973.19.


On the date of publication, Aanchal Sugandh did not have (either directly or indirectly) positions in any of the securities mentioned in this article. All information and data in this article is solely for informational purposes. For more information please view the Barchart Disclosure Policy here.


More news from Barchart

Recent Quotes

View More
Symbol Price Change (%)
AMZN  213.49
+0.00 (0.00%)
AAPL  259.88
+0.00 (0.00%)
AMD  202.68
+0.00 (0.00%)
BAC  47.90
+0.00 (0.00%)
GOOG  306.01
+0.00 (0.00%)
META  647.39
+0.00 (0.00%)
MSFT  409.41
+0.00 (0.00%)
NVDA  182.65
+0.00 (0.00%)
ORCL  151.56
+0.00 (0.00%)
TSLA  398.68
+0.00 (0.00%)
Stock Quote API & Stock News API supplied by www.cloudquote.io
Quotes delayed at least 20 minutes.
By accessing this page, you agree to the Privacy Policy and Terms Of Service.


IntelligentValue Home
Close Window

DISCLAIMER

All content herein is issued solely for informational purposes and is not to be construed as an offer to sell or the solicitation of an offer to buy, nor should it be interpreted as a recommendation to buy, hold or sell (short or otherwise) any security.  All opinions, analyses, and information included herein are based on sources believed to be reliable, but no representation or warranty of any kind, expressed or implied, is made including but not limited to any representation or warranty concerning accuracy, completeness, correctness, timeliness or appropriateness. We undertake no obligation to update such opinions, analysis or information. You should independently verify all information contained on this website. Some information is based on analysis of past performance or hypothetical performance results, which have inherent limitations. We make no representation that any particular equity or strategy will or is likely to achieve profits or losses similar to those shown. Shareholders, employees, writers, contractors, and affiliates associated with ETFOptimize.com may have ownership positions in the securities that are mentioned. If you are not sure if ETFs, algorithmic investing, or a particular investment is right for you, you are urged to consult with a Registered Investment Advisor (RIA). Neither this website nor anyone associated with producing its content are Registered Investment Advisors, and no attempt is made herein to substitute for personalized, professional investment advice. Neither ETFOptimize.com, Global Alpha Investments, Inc., nor its employees, service providers, associates, or affiliates are responsible for any investment losses you may incur as a result of using the information provided herein. Remember that past investment returns may not be indicative of future returns.

Copyright © 1998-2017 ETFOptimize.com, a publication of Optimized Investments, Inc. All rights reserved.