With a market cap of $57.4 billion, NXP Semiconductors N.V. (NXPI) is a global semiconductor company that designs and supplies a wide range of advanced chip solutions across the United States, Europe, and Asia. Headquartered in Eindhoven, the Netherlands, it sells its products through direct sales offices and independent distributors worldwide.
Companies valued at $10 billion or more are generally considered “large-cap” stocks, and NXP Semiconductors fits this criterion perfectly. Its product portfolio includes microcontrollers, application and communication processors, wireless connectivity solutions, analog and interface products, RF devices, security controllers, and environmental and inertial sensors. These technologies support key markets such as automotive, industrial and Internet of Things, mobile devices, and communication infrastructure.
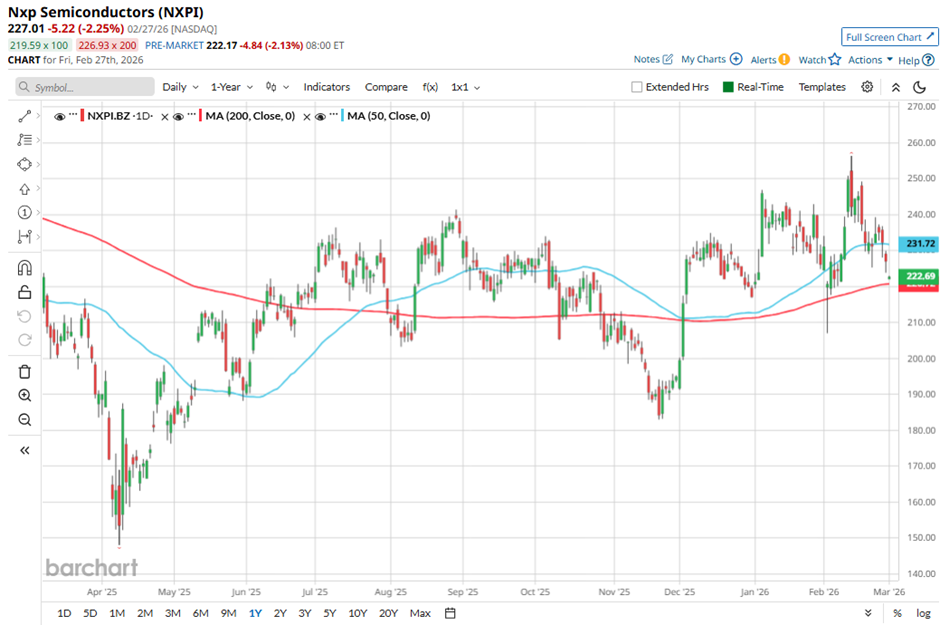
The chipmaker's stock has dipped 11.5% from its 52-week high of $256.36. Over the past three months, shares of NXPI have soared 17.2%, which outpaced the State Street Technology Select Sector SPDR ETF's (XLK) decline of 2.2% during the same period.
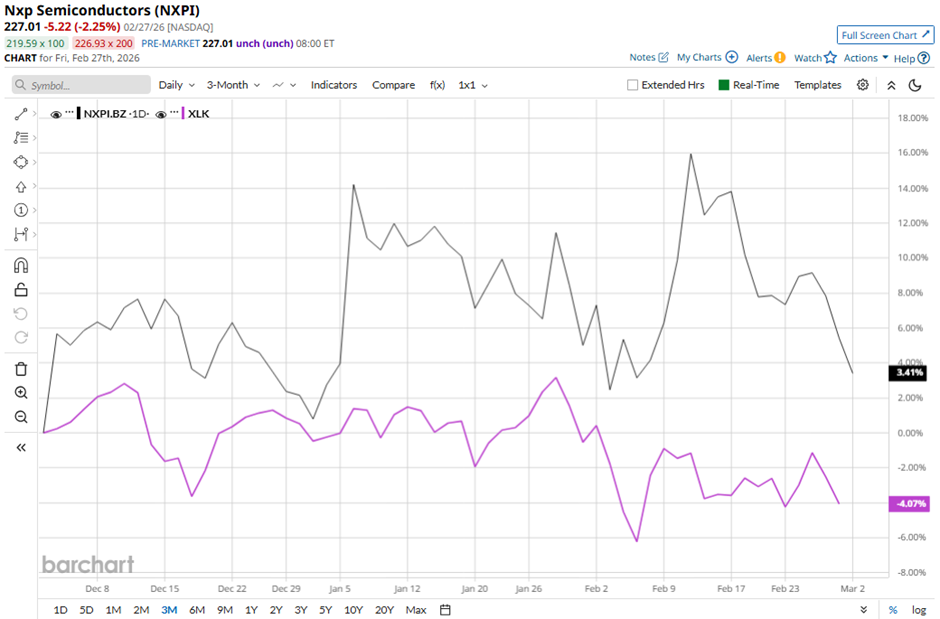
NXPI stock has risen 4.6% on a YTD basis, outperforming XLK’s 3.6% decrease. However, in the longer term, shares of NXP Semiconductors have gained 4.7% over the past 52 weeks, lagging behind XLK’s 24.7% gain over the same time frame.
Despite a few fluctuations, NXPI stock has been trading above its 50-day and 200-day moving averages since December 2025.
Shares of NXPI fell 4.5% following its Q4 2025 results on Feb. 2 as investors reacted to a softer-than-expected Q1 2026 outlook, with revenue guided at a midpoint of $3.15 billion, implying a 6% sequential decline. The decline was compounded by deterioration in GAAP profitability, as Q4 operating margin fell to 22.3%, while EPS dropped 28% quarter-on-quarter to $1.79. Sentiment was further pressured by sluggish full-year performance, with 2025 revenue down 3% year-on-year to $12.27 billion and continued weakness in Communications Infrastructure, which declined 18% year-on-year in Q4.
In comparison, rival Microchip Technology Incorporated (MCHP) has outpaced NXPI stock. MCHP stock has returned 17.1% on a YTD basis and 30.7% over the past 52 weeks.
Despite the stock’s underperformance relative to the sector over the past year, analysts are strongly optimistic about its prospects. NXPI stock has a consensus rating of “Strong Buy” from the 30 analysts covering the stock, and the mean price target of $259.67 is a premium of 14.4% to current levels.
On the date of publication, Sohini Mondal did not have (either directly or indirectly) positions in any of the securities mentioned in this article. All information and data in this article is solely for informational purposes. For more information please view the Barchart Disclosure Policy here.
More news from Barchart