ETFOptimize | High-performance ETF-based Investment Strategies

Quantitative strategies, Wall Street-caliber research, and insightful market analysis since 1998.


ETFOptimize | HOME
Close Window

Is Roper Technologies Stock Underperforming the S&P 500?

Sarasota, Florida-based Roper Technologies, Inc. (ROP) designs and develops software, and technology enabled products and solutions. With a market cap of $36 billion, the company offers industrial controls, fluid handling, pumps, medical and scientific devices, analytical instrumentation products, radio frequency identification (RFID) communication technology, and software solutions.

Companies worth $10 billion or more are generally described as “large-cap stocks,” and ROP perfectly fits that description, with its market cap exceeding this mark, underscoring its size, influence, and dominance within the software application industry. ROP excels in niche segments with innovative tech and products. The company's AI-enabled solutions, like CentralReach, drive automation and customer outcomes, supporting growth.


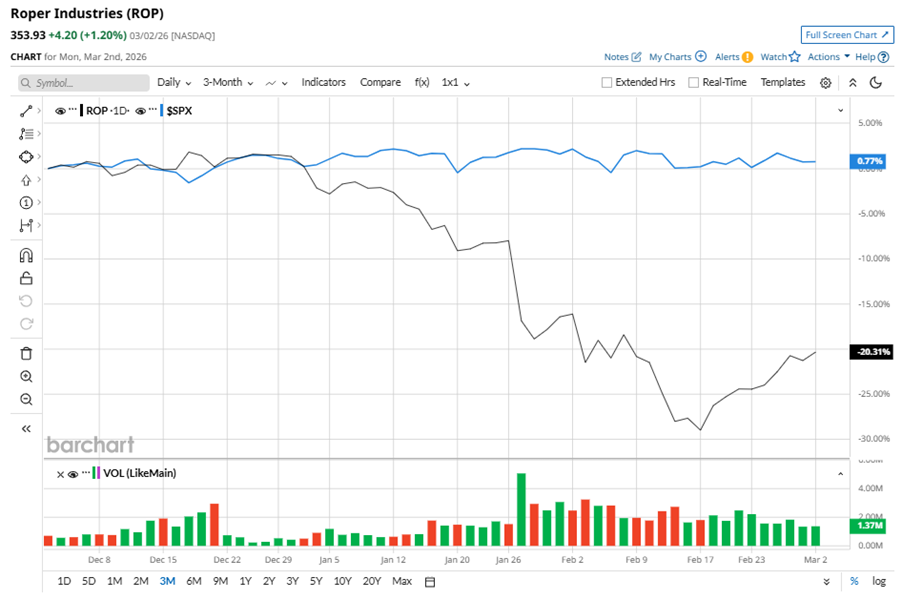
Despite its notable strength, ROP slipped 40.5% from its 52-week high of $595.17, achieved on Mar. 5, 2025. Over the past three months, ROP stock declined 20.3%, underperforming the S&P 500 Index’s ($SPXmarginal gains during the same time frame.

www.barchart.com

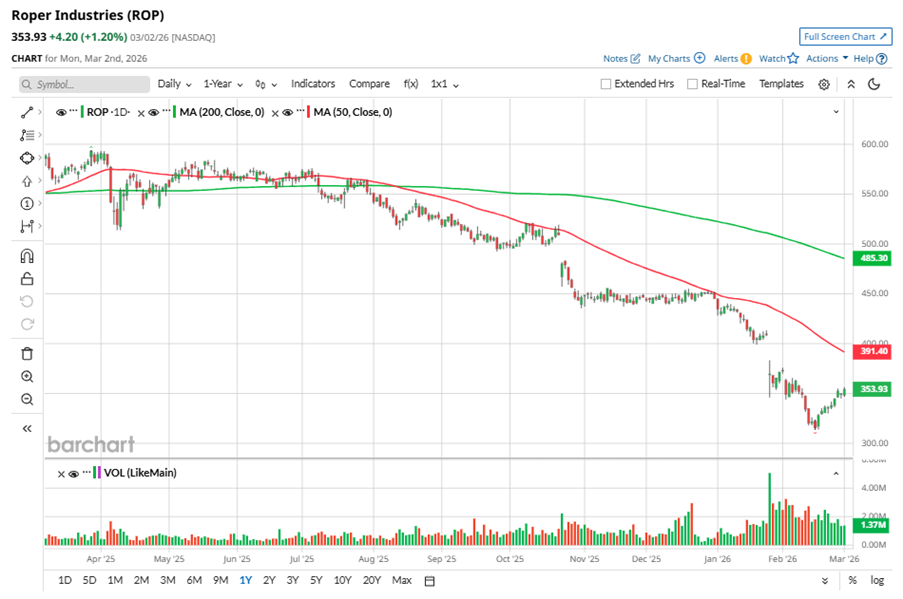
Shares of ROP fell 20.5% on a YTD basis and dipped 39.5% over the past 52 weeks, notably underperforming SPX’s YTD marginal gains and 15.6% returns over the last year.

To confirm the bearish trend, ROP has been trading below its 50-day and 200-day moving averages since early July, 2025, with some fluctuations.

www.barchart.com

On Jan. 27, ROP shares closed down by 9.6% after reporting its Q4 results. Its adjusted EPS of $5.21 topped Wall Street expectations of $5.14. The company’s revenue was $2.06 billion, missing Wall Street forecasts of $2.09 billion. The company expects full-year adjusted EPS in the range of $21.30 to $21.55.

In the competitive arena of software application, Cadence Design Systems, Inc. (CDNS) has taken the lead over ROP, showing resilience with a 3% downtick on a YTD basis and 21.1% gains over the past 52 weeks.

Wall Street analysts are reasonably bullish on ROP’s prospects. The stock has a consensus “Moderate Buy” rating from the 18 analysts covering it, and the mean price target of $458.71 suggests a potential upside of 29.6% from current price levels.


On the date of publication, Neha Panjwani did not have (either directly or indirectly) positions in any of the securities mentioned in this article. All information and data in this article is solely for informational purposes. For more information please view the Barchart Disclosure Policy here.


More news from Barchart

Recent Quotes

View More
Symbol Price Change (%)
AMZN  213.49
+0.00 (0.00%)
AAPL  259.88
+0.00 (0.00%)
AMD  202.68
+0.00 (0.00%)
BAC  47.90
+0.00 (0.00%)
GOOG  306.01
+0.00 (0.00%)
META  647.39
+0.00 (0.00%)
MSFT  409.41
+0.00 (0.00%)
NVDA  182.65
+0.00 (0.00%)
ORCL  151.56
+0.00 (0.00%)
TSLA  398.68
+0.00 (0.00%)
Stock Quote API & Stock News API supplied by www.cloudquote.io
Quotes delayed at least 20 minutes.
By accessing this page, you agree to the Privacy Policy and Terms Of Service.


IntelligentValue Home
Close Window

DISCLAIMER

All content herein is issued solely for informational purposes and is not to be construed as an offer to sell or the solicitation of an offer to buy, nor should it be interpreted as a recommendation to buy, hold or sell (short or otherwise) any security.  All opinions, analyses, and information included herein are based on sources believed to be reliable, but no representation or warranty of any kind, expressed or implied, is made including but not limited to any representation or warranty concerning accuracy, completeness, correctness, timeliness or appropriateness. We undertake no obligation to update such opinions, analysis or information. You should independently verify all information contained on this website. Some information is based on analysis of past performance or hypothetical performance results, which have inherent limitations. We make no representation that any particular equity or strategy will or is likely to achieve profits or losses similar to those shown. Shareholders, employees, writers, contractors, and affiliates associated with ETFOptimize.com may have ownership positions in the securities that are mentioned. If you are not sure if ETFs, algorithmic investing, or a particular investment is right for you, you are urged to consult with a Registered Investment Advisor (RIA). Neither this website nor anyone associated with producing its content are Registered Investment Advisors, and no attempt is made herein to substitute for personalized, professional investment advice. Neither ETFOptimize.com, Global Alpha Investments, Inc., nor its employees, service providers, associates, or affiliates are responsible for any investment losses you may incur as a result of using the information provided herein. Remember that past investment returns may not be indicative of future returns.

Copyright © 1998-2017 ETFOptimize.com, a publication of Optimized Investments, Inc. All rights reserved.