ETFOptimize | High-performance ETF-based Investment Strategies

Quantitative strategies, Wall Street-caliber research, and insightful market analysis since 1998.


ETFOptimize | HOME
Close Window

Is Aon Stock Underperforming the S&P 500?

Dublin, Ireland-based Aon plc (AON) is a leading global professional services firm that provides a broad range of risk management, insurance brokerage, reinsurance, and human capital consulting services to businesses, governments, and institutions worldwide. With a market cap of $72.4 billion, the company helps clients identify, assess, and manage risks through insurance placement, advisory services, and data-driven analytics.

Companies worth $10 billion or more are generally referred to as “large-cap stocks.” Aon fits right into that category. It benefits from several key competitive strengths, including its global scale, diversified service offerings, and strong analytics capabilities. The company operates an extensive worldwide network that allows it to serve multinational clients while leveraging deep industry expertise.


The insurance giant touched its 52-week high of $411.18 last year and is currently trading 17.5% below that peak. Aon shares have dropped 1.6% over the past three months, trailing the S&P 500 Index’s ($SPXmarginal fall.

www.barchart.com

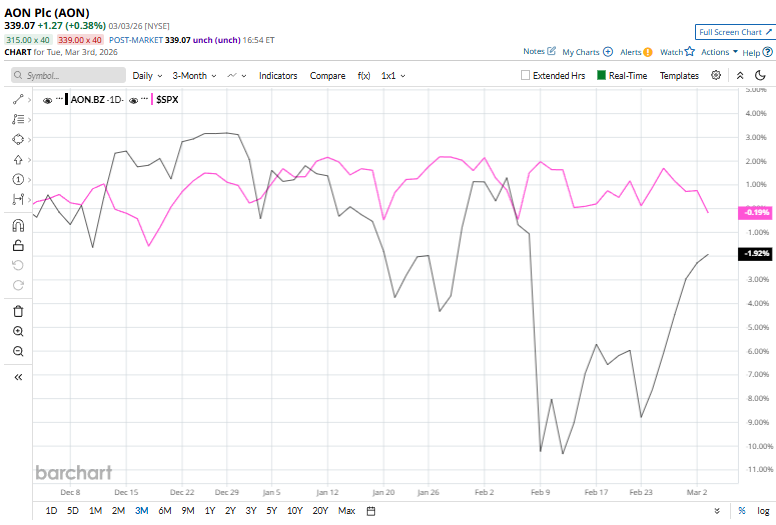
Aon’s performance has remained grim over the longer term as well. Aon stock prices have dipped 1.5% over the past six months and declined 17.2% over the past 52 weeks, compared to SPX’s 5.7% and 16.5% return over the same time frames. 

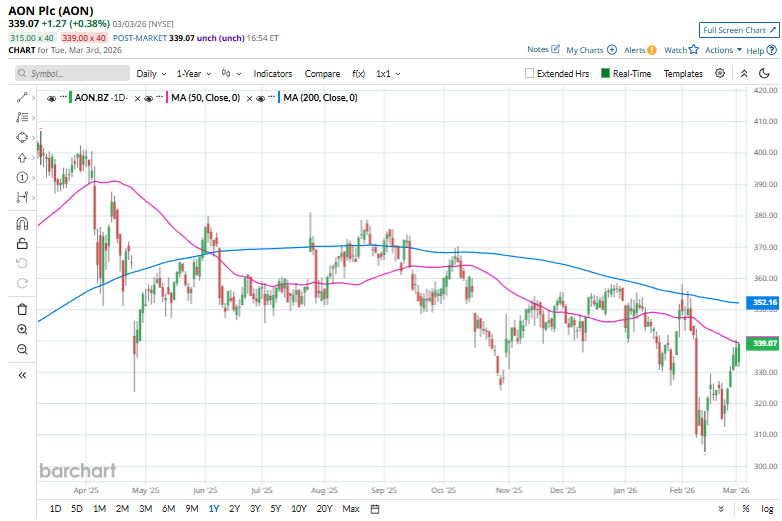
Aon stock has traded below its 200-day moving average since September 2025 and below its 50-day moving average since early February, indicating a downtrend. 

www.barchart.com

On Jan. 30, shares of Aon climbed 2% following the release of its Q4 earnings report. The company posted revenue of $4.3 billion, up 3.7% year over year, though it fell 1.8% short of consensus estimates. On the profitability front, adjusted EPS rose 1.9% to $4.85, exceeding analysts’ expectations of $4.76. Additionally, Aon strengthened its balance sheet by repaying $1.9 billion in debt during 2025 and achieving its target leverage level in the fourth quarter, which helped support investor sentiment.

Aon’s top industry rival, Marsh & McLennan Companies, Inc. (MMC), has also faced challenges, with a 13.7% decline over the past six months and a 13.6% plunge over the past year.

Among the 24 analysts covering the Aon stock, the consensus rating is a “Moderate Buy.” Its mean price target of $398.79 suggests a 17.6% upside potential from current price levels.


On the date of publication, Kritika Sarmah did not have (either directly or indirectly) positions in any of the securities mentioned in this article. All information and data in this article is solely for informational purposes. For more information please view the Barchart Disclosure Policy here.


More news from Barchart

Recent Quotes

View More
Symbol Price Change (%)
AMZN  213.49
+0.00 (0.00%)
AAPL  259.88
+0.00 (0.00%)
AMD  202.68
+0.00 (0.00%)
BAC  47.90
+0.00 (0.00%)
GOOG  306.01
+0.00 (0.00%)
META  647.39
+0.00 (0.00%)
MSFT  409.41
+0.00 (0.00%)
NVDA  182.65
+0.00 (0.00%)
ORCL  151.56
+0.00 (0.00%)
TSLA  398.68
+0.00 (0.00%)
Stock Quote API & Stock News API supplied by www.cloudquote.io
Quotes delayed at least 20 minutes.
By accessing this page, you agree to the Privacy Policy and Terms Of Service.


IntelligentValue Home
Close Window

DISCLAIMER

All content herein is issued solely for informational purposes and is not to be construed as an offer to sell or the solicitation of an offer to buy, nor should it be interpreted as a recommendation to buy, hold or sell (short or otherwise) any security.  All opinions, analyses, and information included herein are based on sources believed to be reliable, but no representation or warranty of any kind, expressed or implied, is made including but not limited to any representation or warranty concerning accuracy, completeness, correctness, timeliness or appropriateness. We undertake no obligation to update such opinions, analysis or information. You should independently verify all information contained on this website. Some information is based on analysis of past performance or hypothetical performance results, which have inherent limitations. We make no representation that any particular equity or strategy will or is likely to achieve profits or losses similar to those shown. Shareholders, employees, writers, contractors, and affiliates associated with ETFOptimize.com may have ownership positions in the securities that are mentioned. If you are not sure if ETFs, algorithmic investing, or a particular investment is right for you, you are urged to consult with a Registered Investment Advisor (RIA). Neither this website nor anyone associated with producing its content are Registered Investment Advisors, and no attempt is made herein to substitute for personalized, professional investment advice. Neither ETFOptimize.com, Global Alpha Investments, Inc., nor its employees, service providers, associates, or affiliates are responsible for any investment losses you may incur as a result of using the information provided herein. Remember that past investment returns may not be indicative of future returns.

Copyright © 1998-2017 ETFOptimize.com, a publication of Optimized Investments, Inc. All rights reserved.