The Dallas, Texas-based Copart, Inc. (CPRT) is a global online vehicle auction and remarketing marketplace that connects sellers and buyers of used, salvage, and end-of-life vehicles. The company combines digital bidding technology, integrated logistics, and data-driven tools to streamline vehicle sales and recovery.
With a market cap of nearly $37.2 billion, Copart sits in the “large-cap” territory, a class reserved for companies valued above $10 billion. The scale reflects a strong foothold in digital vehicle remarketing, supported by a broad global auction network and a technology-driven sales platform.
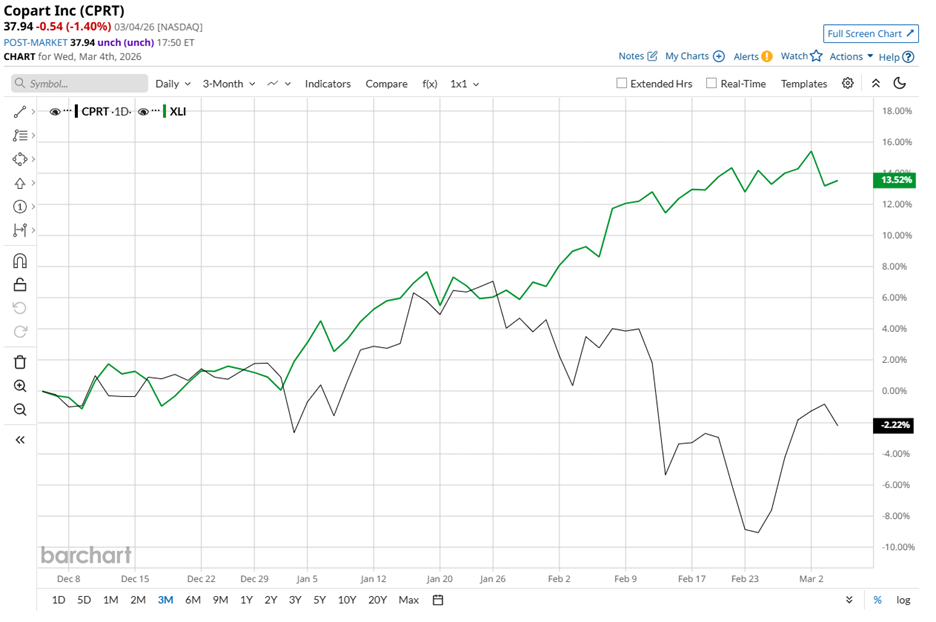
CPRT stock is currently trading 40.6% below its 52-week high of $63.85 reached in May 2025. Over the past three months, the stock has declined 2.2%. During the same period, the State Street Industrial Select Sector SPDR ETF (XLI) gained 13.5%, signaling that investors have leaned toward broader industrial exposure, while Copart’s shares have drifted sideways to lower levels.
The longer-term performance paints a similar picture. Over the past 52 weeks, CPRT stock has fallen 30.1% and declined 3.1% year-to-date (YTD). Meanwhile, XLI surged 33.5% over the same 52-week stretch and advanced 13.4% in 2026, placing Copart on the back foot relative to the broader industrial sector.
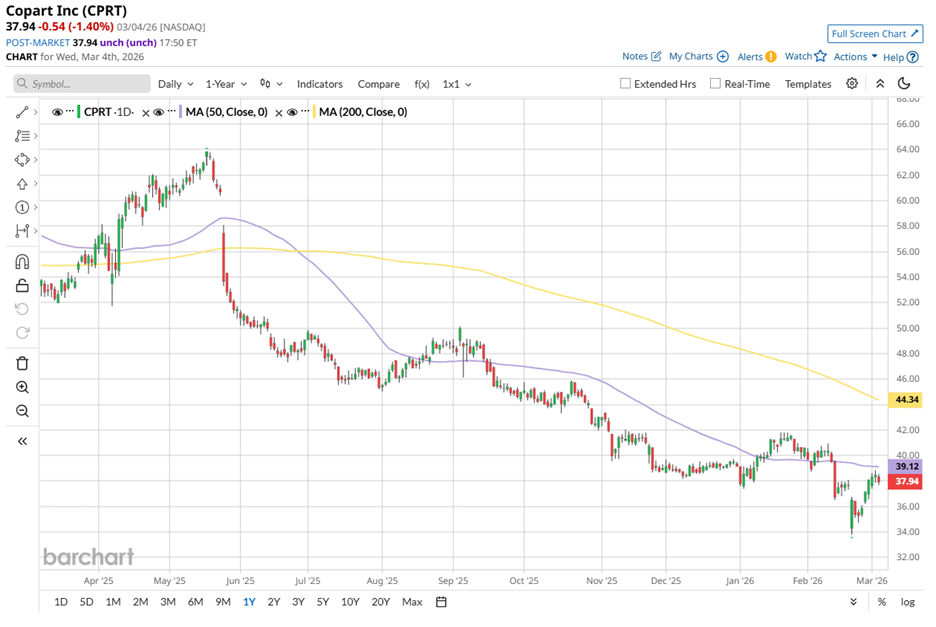
Technical indicators echo the cautious tone. Shares briefly climbed above the 50-day moving average in mid-August 2025 and again in January, but neither rally held. The stock has since slipped back below its $39.12 50-day average and has spent most of the period since June 2025 trading under that level.
The longer-term picture is similarly weak, with Copart’s shares remaining consistently below the 200-day moving average of $44.34 since June 2025.
Earnings added another layer to the narrative. On Feb. 19, Copart released its Q2 2026 financial results, and the stock fell 3.1% in the following trading session. Revenue came in at $1.12 billion, reflecting a 3.6% year-over-year decline. Net income slipped 9.5% from the prior year to $350.73 million, while diluted EPS eased 10% to $0.36. Both revenue and earnings landed below analyst expectations.
Management nevertheless highlighted a few stabilizing forces. Copart maintains roughly $6.40 billion in liquidity and carries no debt on its balance sheet. The company also reported record U.S. insurance average selling prices.
These factors offer a cushion. A strong balance sheet and resilient auction pricing can soften pressure from weaker volumes or tighter margins, though they cannot fully erase the underlying operational risks.
A look across the competitive landscape adds a useful perspective. Copart's rival, AutoNation, Inc. (AN) has delivered a 14% gain over the past 52 weeks, although its stock is down 5.3% YTD. The performance gap draws a clear line in the sand. If Copart improves operational momentum and regains investor confidence, the stock still has ground it can reclaim.
Despite the recent turbulence, Wall Street has not stepped away from the table. Among 12 analysts covering CPRT stock, the consensus rating stands at a “Moderate Buy.” Meanwhile, the average price target of $47.67 implies roughly 25.6% upside from current levels.
On the date of publication, Aanchal Sugandh did not have (either directly or indirectly) positions in any of the securities mentioned in this article. All information and data in this article is solely for informational purposes. For more information please view the Barchart Disclosure Policy here.
More news from Barchart
- Evercore ISI Says This 1 Dividend Stock Could Be a Winner Amid the Software Apocalypse
- As Akamai Loads Up on GPUs, Should You Buy, Sell, or Hold AKAM Stock?
- Where Should You Put $10,000 Today? Look at These 3 Sectors That Are Winning While Tech Slumps.
- Citron Research Is Betting Against Sandisk Stock. Should You?


