ETFOptimize | High-performance ETF-based Investment Strategies

Quantitative strategies, Wall Street-caliber research, and insightful market analysis since 1998.


ETFOptimize | HOME
Close Window

Is D.R. Horton Stock Underperforming the Nasdaq?

With a market cap of $44.2 billion, D.R. Horton, Inc. (DHI) focuses on acquiring and developing land, as well as constructing and selling residential homes across 126 markets in 36 states. Its housing portfolio includes single-family detached homes and attached housing such as townhomes and duplexes. 

Companies valued at $10 billion or more are generally considered "large-cap" stocks, and D.R. Horton fits this criterion perfectly. In addition to homebuilding, it offers mortgage financing, title services, rental property development, insurance-related operations, and manages various real estate and water-related assets.


Shares of the homebuilder have fallen 18.2% from its 52-week high of $184.54DHI stock has decreased 5% over the past three months, a more pronounced decline than the broader Nasdaq Composite’s ($NASX) 3% dip during the same time frame. 

www.barchart.com

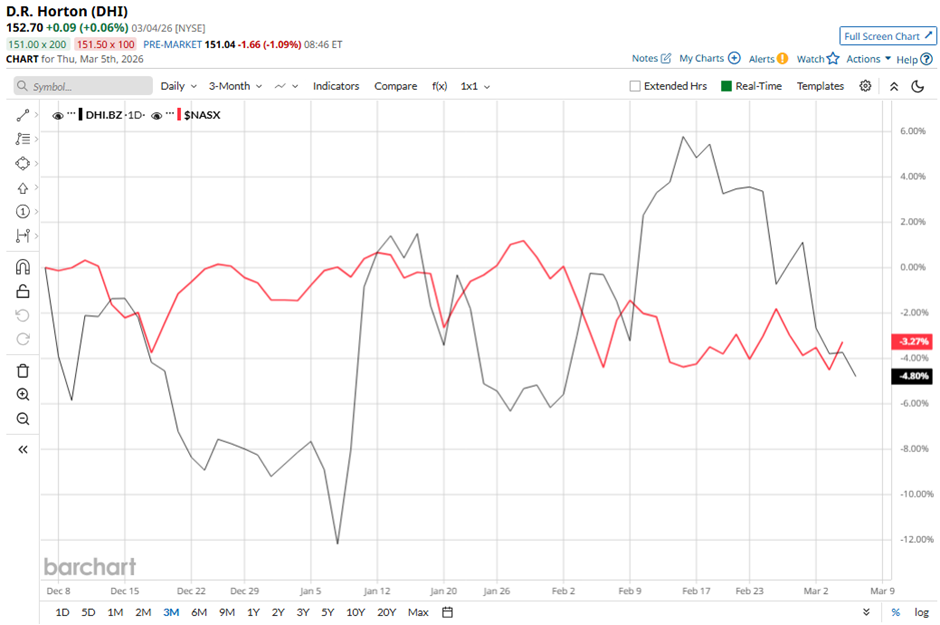
In the longer term, shares of D.R. Horton have surged 21.3% over the past 52 weeks, lagging behind the NASX’s 24.7% return over the same time frame. However, DHI stock is up 6% on a YTD basis, exceeding NASX's 1.9% drop.

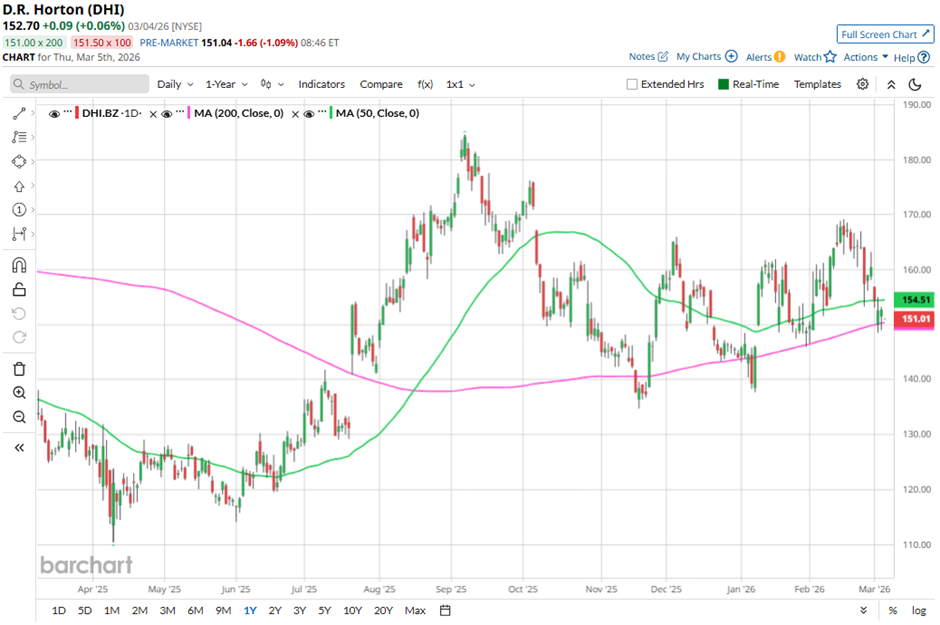
The stock has been trading above its 200-day moving average since late July 2025.

www.barchart.com

Shares of D.R. Horton fell 1.8% on Jan. 20 after the company reported Q1 2026 net income of $594.8 million ($2.03 per share), which declined 30% year-over-year, while EPS dropped 22%. The report also showed homebuilding revenue fell 9% to $6.5 billion, and homes closed declined 7% to 17,818, indicating slowing housing activity despite total consolidated revenue of $6.9 billion. Additionally, management warned that affordability constraints, cautious consumer sentiment, and continued elevated sales incentives in fiscal 2026 could pressure demand and margins.

In comparison, rival Lennar Corporation (LEN) has lagged behind DHI stock. LEN stock has gained 3.1% on a YTD basis and decreased 13.1% over the past 52 weeks. 

Due to the stock's underperformance relative to the Nasdaq over the past year, analysts remain cautious about its prospects. DHI stock has a consensus rating of "Hold" from the 21 analysts covering the stock, and the mean price target of $161.57 suggests a premium of 5.8% to current levels.


On the date of publication, Sohini Mondal did not have (either directly or indirectly) positions in any of the securities mentioned in this article. All information and data in this article is solely for informational purposes. For more information please view the Barchart Disclosure Policy here.


More news from Barchart

Recent Quotes

View More
Symbol Price Change (%)
AMZN  213.49
+0.28 (0.13%)
AAPL  259.88
+2.42 (0.94%)
AMD  202.68
+10.25 (5.33%)
BAC  47.90
-0.74 (-1.52%)
GOOG  306.01
+7.71 (2.58%)
META  647.39
+2.53 (0.39%)
MSFT  409.41
+0.45 (0.11%)
NVDA  182.65
+4.83 (2.72%)
ORCL  151.56
-1.40 (-0.92%)
TSLA  398.68
+1.95 (0.49%)
Stock Quote API & Stock News API supplied by www.cloudquote.io
Quotes delayed at least 20 minutes.
By accessing this page, you agree to the Privacy Policy and Terms Of Service.


IntelligentValue Home
Close Window

DISCLAIMER

All content herein is issued solely for informational purposes and is not to be construed as an offer to sell or the solicitation of an offer to buy, nor should it be interpreted as a recommendation to buy, hold or sell (short or otherwise) any security.  All opinions, analyses, and information included herein are based on sources believed to be reliable, but no representation or warranty of any kind, expressed or implied, is made including but not limited to any representation or warranty concerning accuracy, completeness, correctness, timeliness or appropriateness. We undertake no obligation to update such opinions, analysis or information. You should independently verify all information contained on this website. Some information is based on analysis of past performance or hypothetical performance results, which have inherent limitations. We make no representation that any particular equity or strategy will or is likely to achieve profits or losses similar to those shown. Shareholders, employees, writers, contractors, and affiliates associated with ETFOptimize.com may have ownership positions in the securities that are mentioned. If you are not sure if ETFs, algorithmic investing, or a particular investment is right for you, you are urged to consult with a Registered Investment Advisor (RIA). Neither this website nor anyone associated with producing its content are Registered Investment Advisors, and no attempt is made herein to substitute for personalized, professional investment advice. Neither ETFOptimize.com, Global Alpha Investments, Inc., nor its employees, service providers, associates, or affiliates are responsible for any investment losses you may incur as a result of using the information provided herein. Remember that past investment returns may not be indicative of future returns.

Copyright © 1998-2017 ETFOptimize.com, a publication of Optimized Investments, Inc. All rights reserved.