The Estée Lauder Companies Inc. (EL), headquartered in New York, manufactures, markets, and sells skin care, makeup, fragrance, and hair care products. Valued at $35.9 billion by market cap, the company's products are sold through department stores, mass retailers, company-owned retail stores, hair salons, and travel-related establishments.
Companies worth $10 billion or more are generally described as “large-cap stocks,” and EL perfectly fits that description, with its market cap exceeding this mark, underscoring its size, influence, and dominance within the household & personal products industry. EL's strength lies in its diversified portfolio of iconic brands like La Mer, driving premium pricing and loyalty. Its global reach and omnichannel distribution network provide a competitive edge, enabling access to diverse markets and mitigating regional risks.
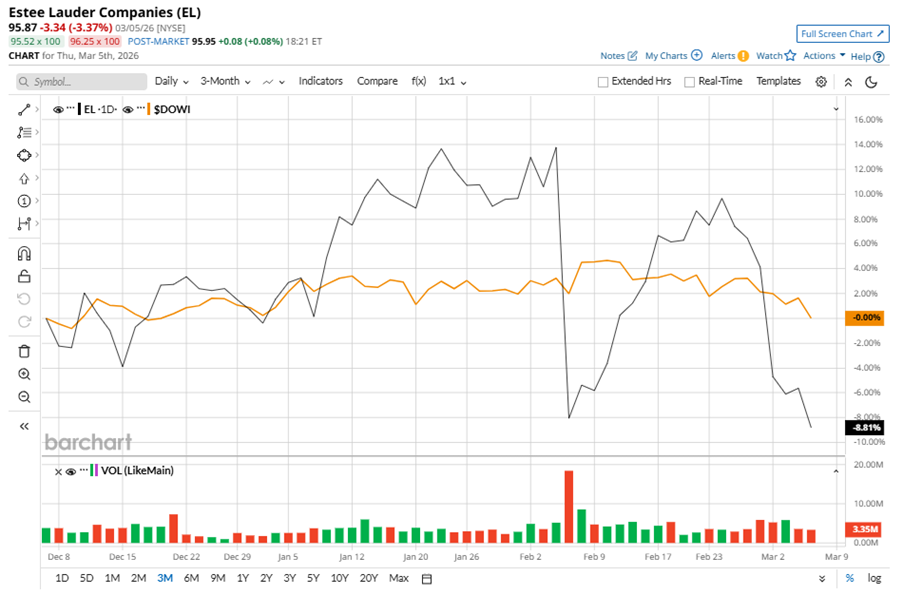
Despite its notable strength, EL slipped 21.2% from its 52-week high of $121.64, achieved on Feb. 3. Over the past three months, EL stock has declined 8.8%, underperforming the Dow Jones Industrials Average’s ($DOWI) flat performance during the same time frame.
Shares of EL fell 8.5% on a YTD basis, underperforming DOWI’s YTD marginal losses. However, the stock climbed 33.3% over the past 52 weeks, outperforming DOWI’s 11.5% returns over the last year.
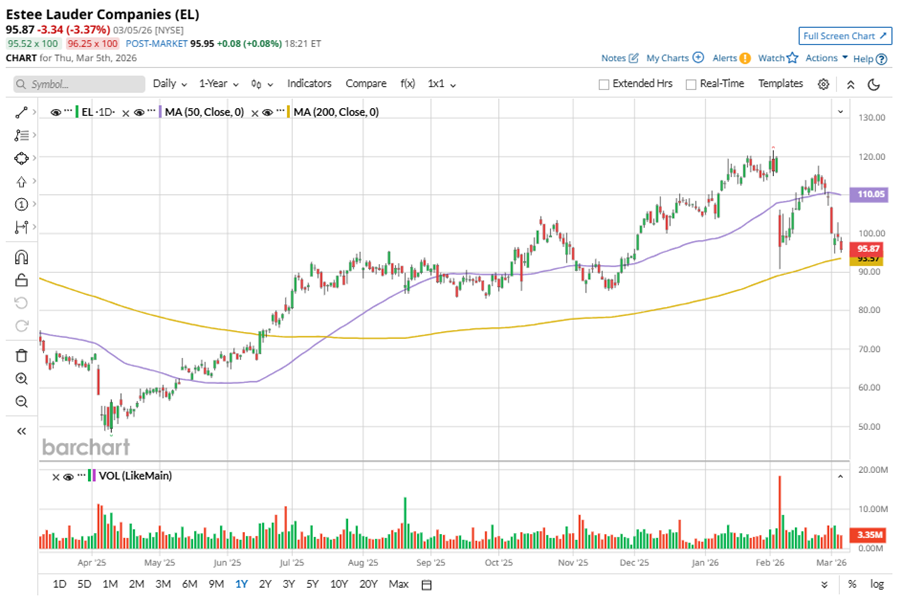
To confirm the bullish trend, EL has been trading above its 200-day moving average since mid-June, 2025. However, the stock has been trading below its 50-day moving average since early February, with slight fluctuations.
EL's results show strong growth in skincare and fragrance, driven by China and travel retail, with improved margins. In addition, online channels and emerging markets are growth drivers of EL, with management focusing on innovation and cost savings.
On Feb. 5, EL shares closed down more than 19% after reporting its Q2 results. Its adjusted EPS of $0.89 topped Wall Street expectations of $0.84. The company’s revenue was $4.2 billion, matching Wall Street forecasts.
EL’s rival, e.l.f. Beauty, Inc. (ELF) shares have taken the lead over the stock, with an 8.6% uptick on a YTD basis, but lagged behind the stock with 27.6% gains over the past 52 weeks.
Wall Street analysts are reasonably bullish on EL’s prospects. The stock has a consensus “Moderate Buy” rating from the 24 analysts covering it, and the mean price target of $107.61 suggests a potential upside of 12.2% from current price levels.
On the date of publication, Neha Panjwani did not have (either directly or indirectly) positions in any of the securities mentioned in this article. All information and data in this article is solely for informational purposes. For more information please view the Barchart Disclosure Policy here.
More news from Barchart
- Morgan Stanley Says Nvidia Just Regained Its No. 1 Spot. Why NVDA Stock Is Back on the Throne.
- S&P Futures Slip as Bond Yields Climb After Jump in Oil, Key U.S. Jobs Report in Focus
- This Dividend Stock Yields 3.1% and Offers Massive Upside: Time to Buy?
- SoundHound Is One of the Most Short Stocks Right Now. Should You Bet on a SOUN Squeeze?


