ETFOptimize | High-performance ETF-based Investment Strategies

Quantitative strategies, Wall Street-caliber research, and insightful market analysis since 1998.


ETFOptimize | HOME
Close Window

How Is PG&E Corporation's Stock Performance Compared to Other Utility Stocks?

Valued at a market cap of $40 billion, PG&E Corporation (PCG) is an Oakland, California-based company that sells and delivers electricity and natural gas. 

Companies worth $10 billion or more are typically classified as “large-cap stocks,” and PCG fits the label perfectly, with its market cap exceeding this threshold, underscoring its size, influence, and dominance within the utilities - regulated electric industry. The company has shifted towards aggressive grid modernization and climate resilience, specifically through its industry-leading "undergrounding" program and the integration of "Distributed Intelligence" to manage one of the nation's most complex renewable energy grids.


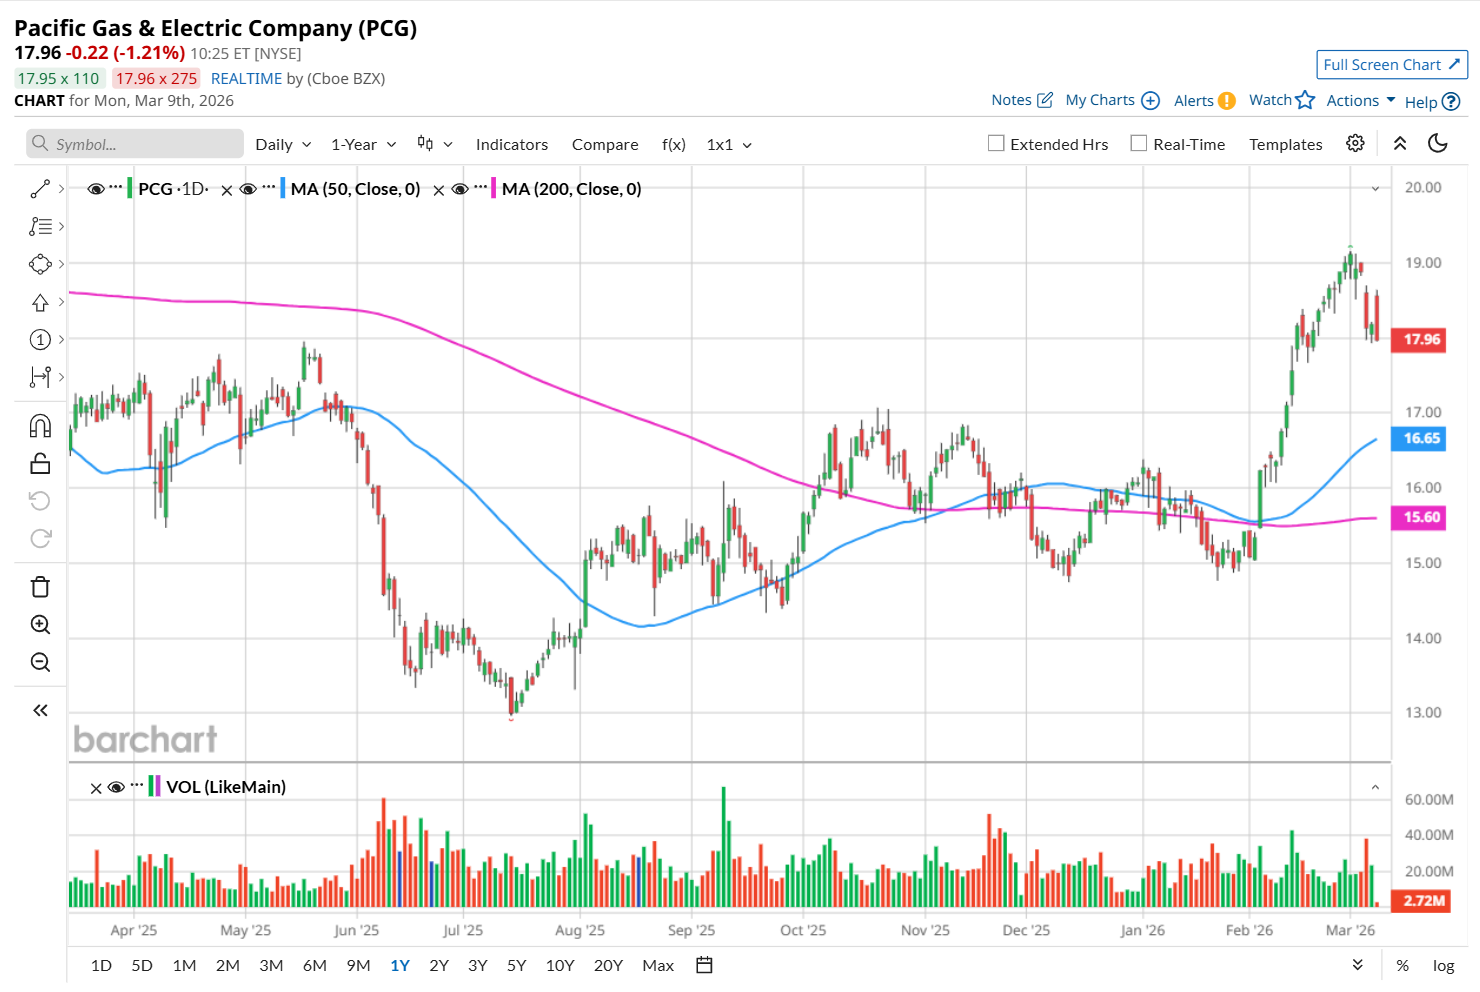
This utility company is currently trading 5.5% below its 52-week high of $19.16, reached on Mar. 2. Shares of PCG have rallied 20.8% over the past three months, outpacing the State Street Utilities Select Sector SPDR ETF’s (XLU8.1% rise during the same time frame.

www.barchart.com 

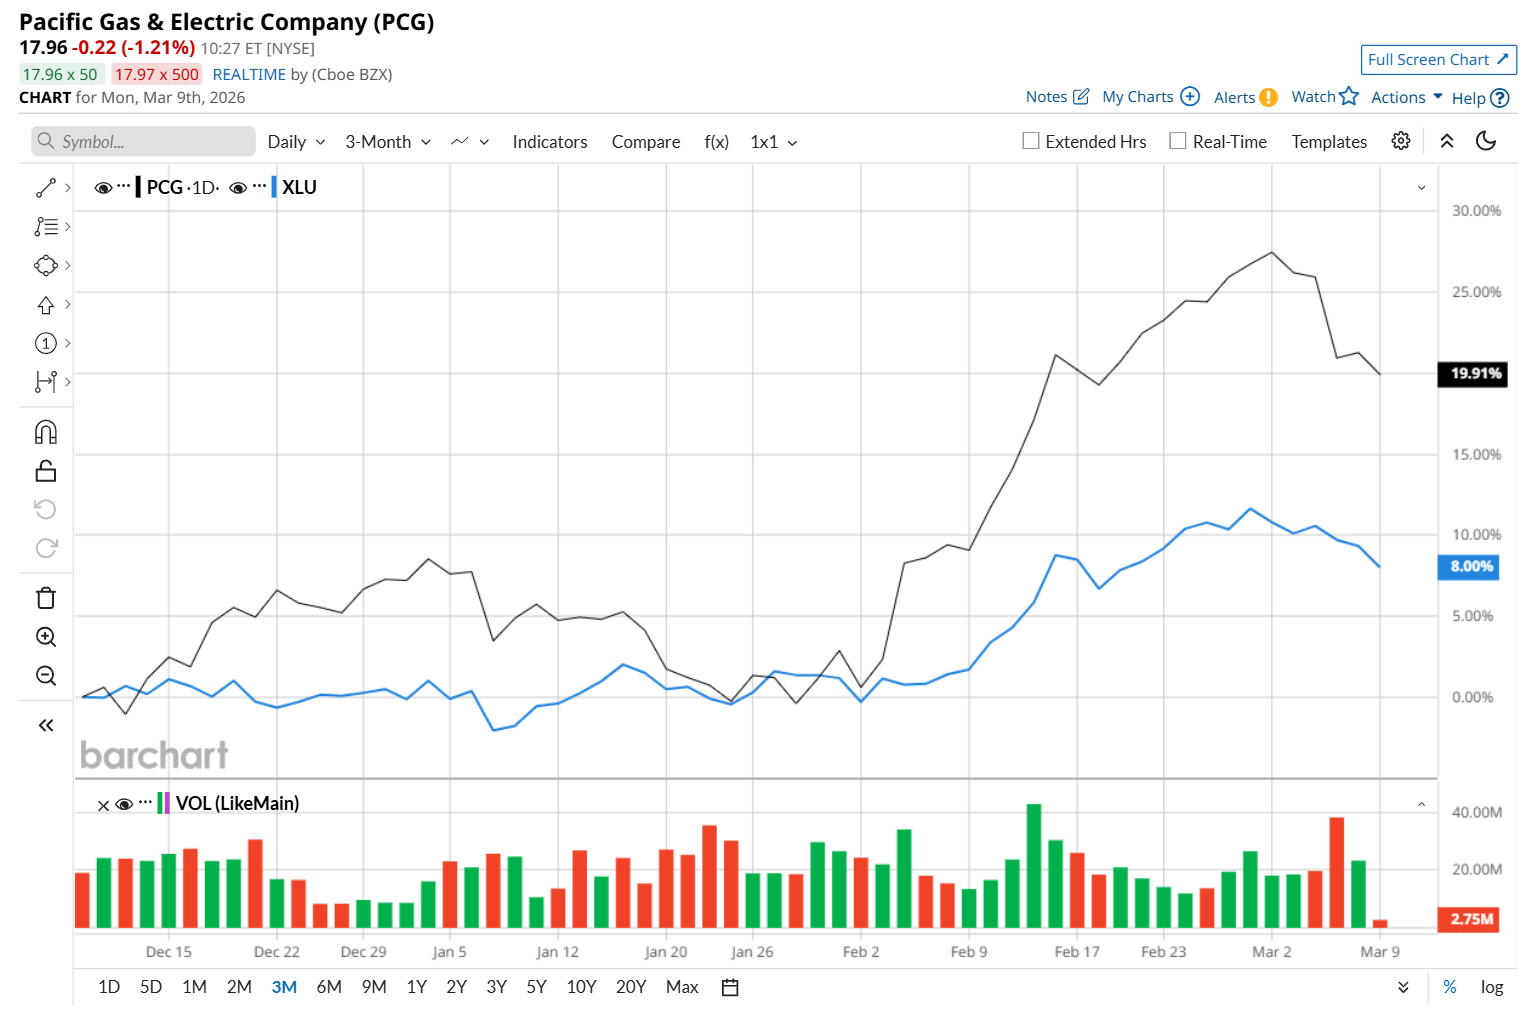
Moreover, on a YTD basis, shares of PCG are up 12.7%, compared to XLU’s 8.3% return. However, in the longer term, PCG has gained 13.4% over the past 52 weeks, trailing behind XLU’s 19.6% uptick over the same time frame. 

To confirm its recent bullish trend, PCG has been trading above its 200-day and 50-day moving averages since early February. 

www.barchart.com 

Shares of PCG surged 2.7% on Feb. 12, after delivering its Q4 results. The company announced its fourth reduction in residential bundled electric rates over the past two years, while natural gas rates also declined. In addition, its core EPS of $0.36 increased 16.1% year over year, matching analysts’ expectations. The company further strengthened investor sentiment by raising its fiscal 2026 core EPS guidance to a range of $1.64 to $1.66.

PCG has outperformed its rival, Duke Energy Corporation (DUK), which gained 12.2% over the past 52 weeks and 11.7% on a YTD basis. 

Looking at PCG’s recent outperformance, analysts remain highly optimistic about its prospects. The stock has a consensus rating of "Strong Buy” from the 17 analysts covering it, and the mean price target of $22.32 suggests a 23% premium to its current price levels. 


On the date of publication, Neharika Jain did not have (either directly or indirectly) positions in any of the securities mentioned in this article. All information and data in this article is solely for informational purposes. For more information please view the Barchart Disclosure Policy here.


More news from Barchart

Recent Quotes

View More
Symbol Price Change (%)
AMZN  213.49
+0.00 (0.00%)
AAPL  259.88
+0.00 (0.00%)
AMD  202.68
+0.00 (0.00%)
BAC  47.90
+0.00 (0.00%)
GOOG  306.01
+0.00 (0.00%)
META  647.39
+0.00 (0.00%)
MSFT  409.41
+0.00 (0.00%)
NVDA  182.65
+0.00 (0.00%)
ORCL  151.56
+0.00 (0.00%)
TSLA  398.68
+0.00 (0.00%)
Stock Quote API & Stock News API supplied by www.cloudquote.io
Quotes delayed at least 20 minutes.
By accessing this page, you agree to the Privacy Policy and Terms Of Service.


IntelligentValue Home
Close Window

DISCLAIMER

All content herein is issued solely for informational purposes and is not to be construed as an offer to sell or the solicitation of an offer to buy, nor should it be interpreted as a recommendation to buy, hold or sell (short or otherwise) any security.  All opinions, analyses, and information included herein are based on sources believed to be reliable, but no representation or warranty of any kind, expressed or implied, is made including but not limited to any representation or warranty concerning accuracy, completeness, correctness, timeliness or appropriateness. We undertake no obligation to update such opinions, analysis or information. You should independently verify all information contained on this website. Some information is based on analysis of past performance or hypothetical performance results, which have inherent limitations. We make no representation that any particular equity or strategy will or is likely to achieve profits or losses similar to those shown. Shareholders, employees, writers, contractors, and affiliates associated with ETFOptimize.com may have ownership positions in the securities that are mentioned. If you are not sure if ETFs, algorithmic investing, or a particular investment is right for you, you are urged to consult with a Registered Investment Advisor (RIA). Neither this website nor anyone associated with producing its content are Registered Investment Advisors, and no attempt is made herein to substitute for personalized, professional investment advice. Neither ETFOptimize.com, Global Alpha Investments, Inc., nor its employees, service providers, associates, or affiliates are responsible for any investment losses you may incur as a result of using the information provided herein. Remember that past investment returns may not be indicative of future returns.

Copyright © 1998-2017 ETFOptimize.com, a publication of Optimized Investments, Inc. All rights reserved.