Since March 30, the S&P 500 Index ($SPX) (SPY) has risen about 19% over approximately 45 calendar days, which is a remarkable move in such a short period of time. The pink box on the chart below represents an aggregate average of the expected moves of the top 10 holdings in the index, which is effectively “the Magnificent 7 plus 3.”
That totals about a 5% move from the prior month’s standard options expiration on April 17, which is something we pointed out on that day’s episode of Market on Close.
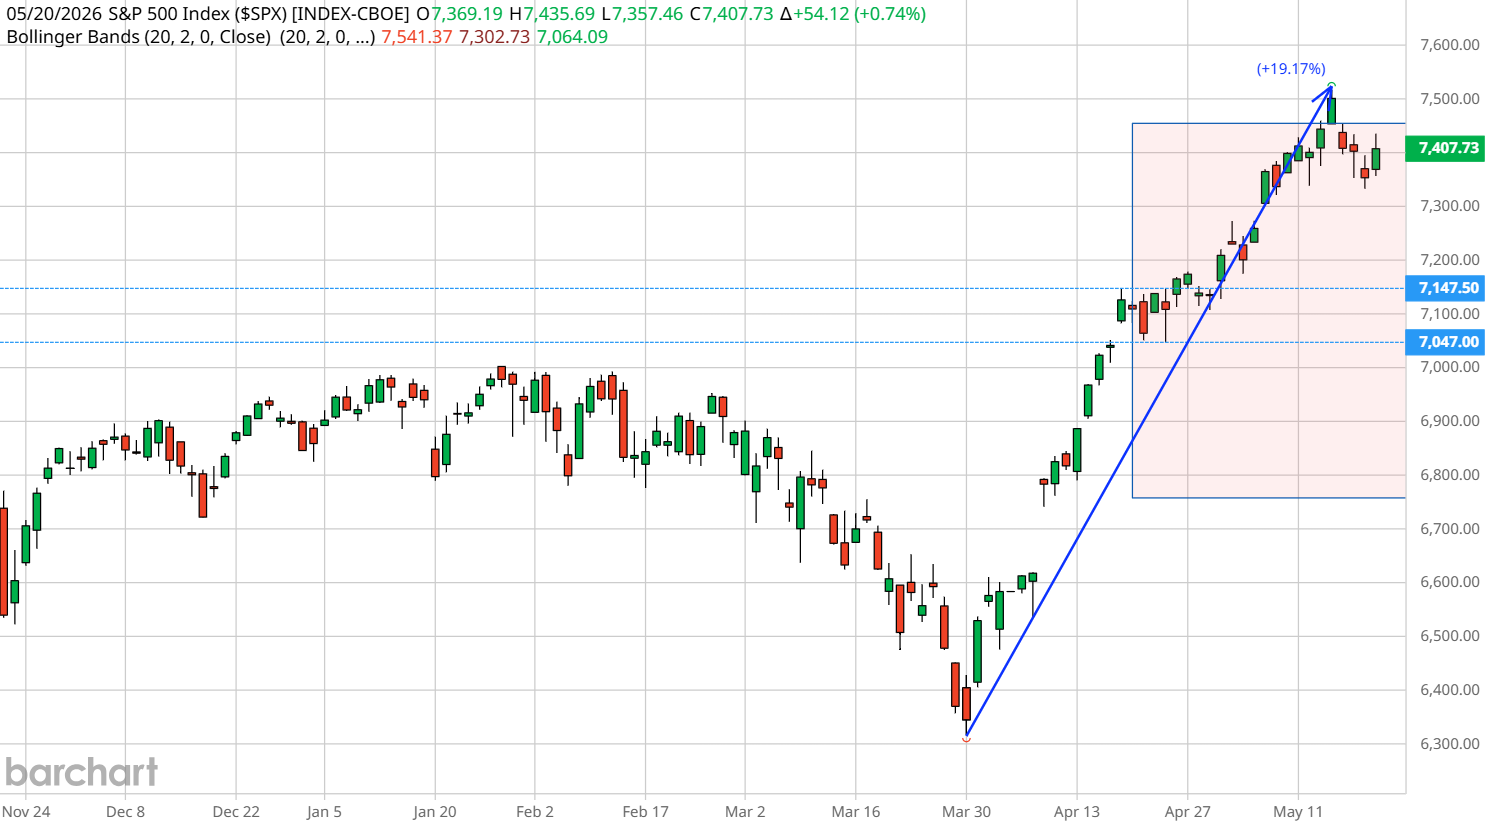
It’s interesting how accurately that projection came to fruition. But what can technical analysis tell us about what might come next and what probable levels we can look for?
How to Map the Market’s Next Move
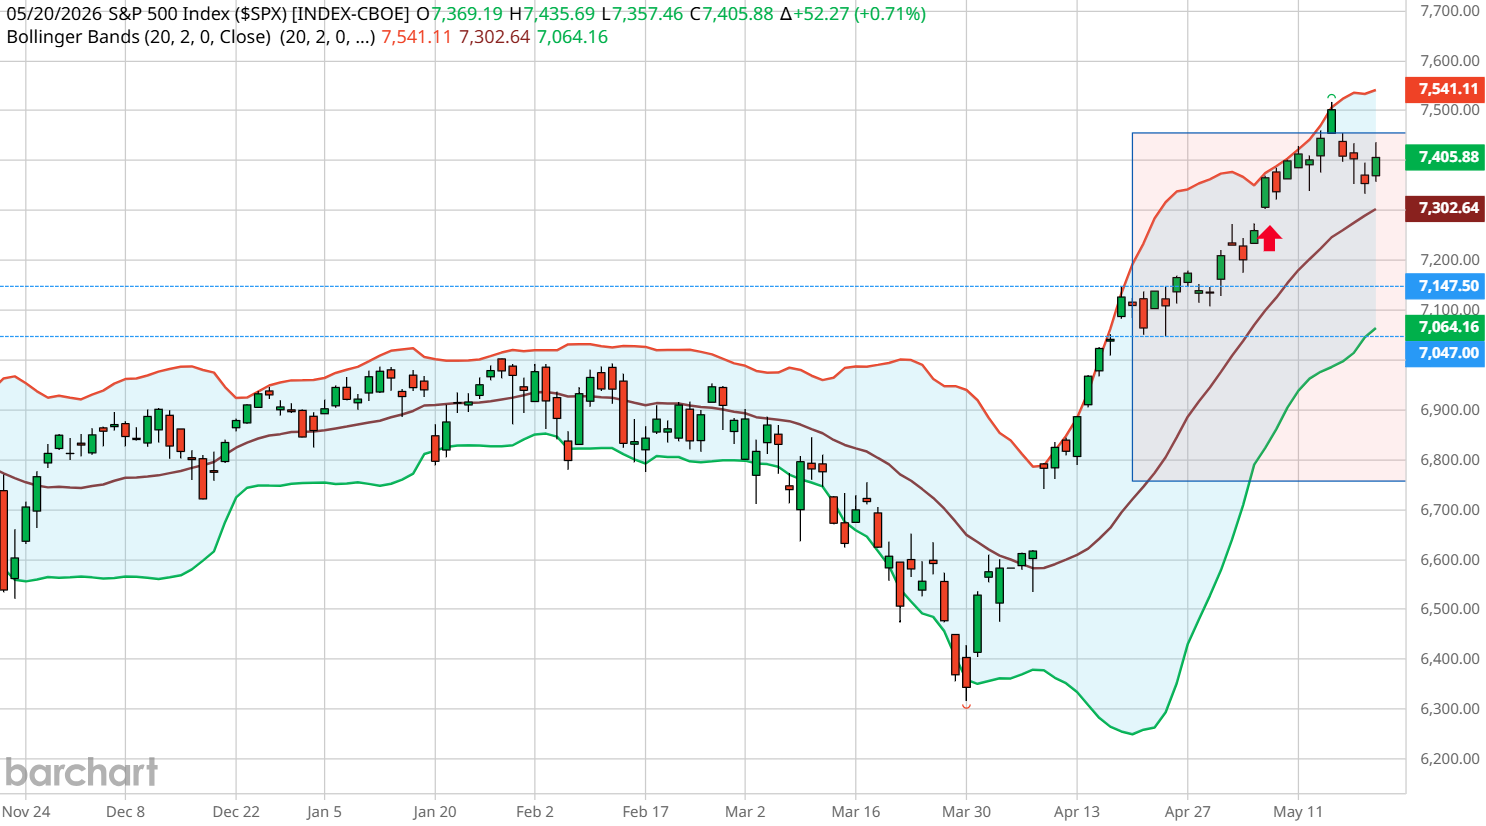
One tool I like for defining a probable range, or what I call the "playing field of probability," is the Bollinger Band study. Bollinger Bands are a statistical measurement of standard deviation around a moving average. The default setting typically uses 2 standard deviations and a 20-period moving average, as represented by the bands.
Bollinger Bands tell us that at any given moment, approximately 95% of price action falls within two standard deviations. When the price extends beyond the bands and then returns inside, there is a greater probability that it will revert to the mean, which is currently located near the brown line, at around 7,300.
The S&P ‘Window of Opportunity’
Interestingly enough, this aligns with a runaway gap low on May 6, marked by the red arrow. Gaps are called "windows of opportunity" and can act as levels of support or resistance. In this case, it’s support.
Below the mean is the lower band at 7,060, which was the index's expected downside move based on last month’s options pricing (blue dotted line). Again, Bollinger Band theory tells us that extended moves that snap back quickly to the mean are likely to shoot to the opposite band.
Tying It Together With Fibonacci
Why do I point this out? Because if we draw Fibonacci retracement levels based on the recent low and high of the S&P’s move, the lower band aligns with a 38% retracement.
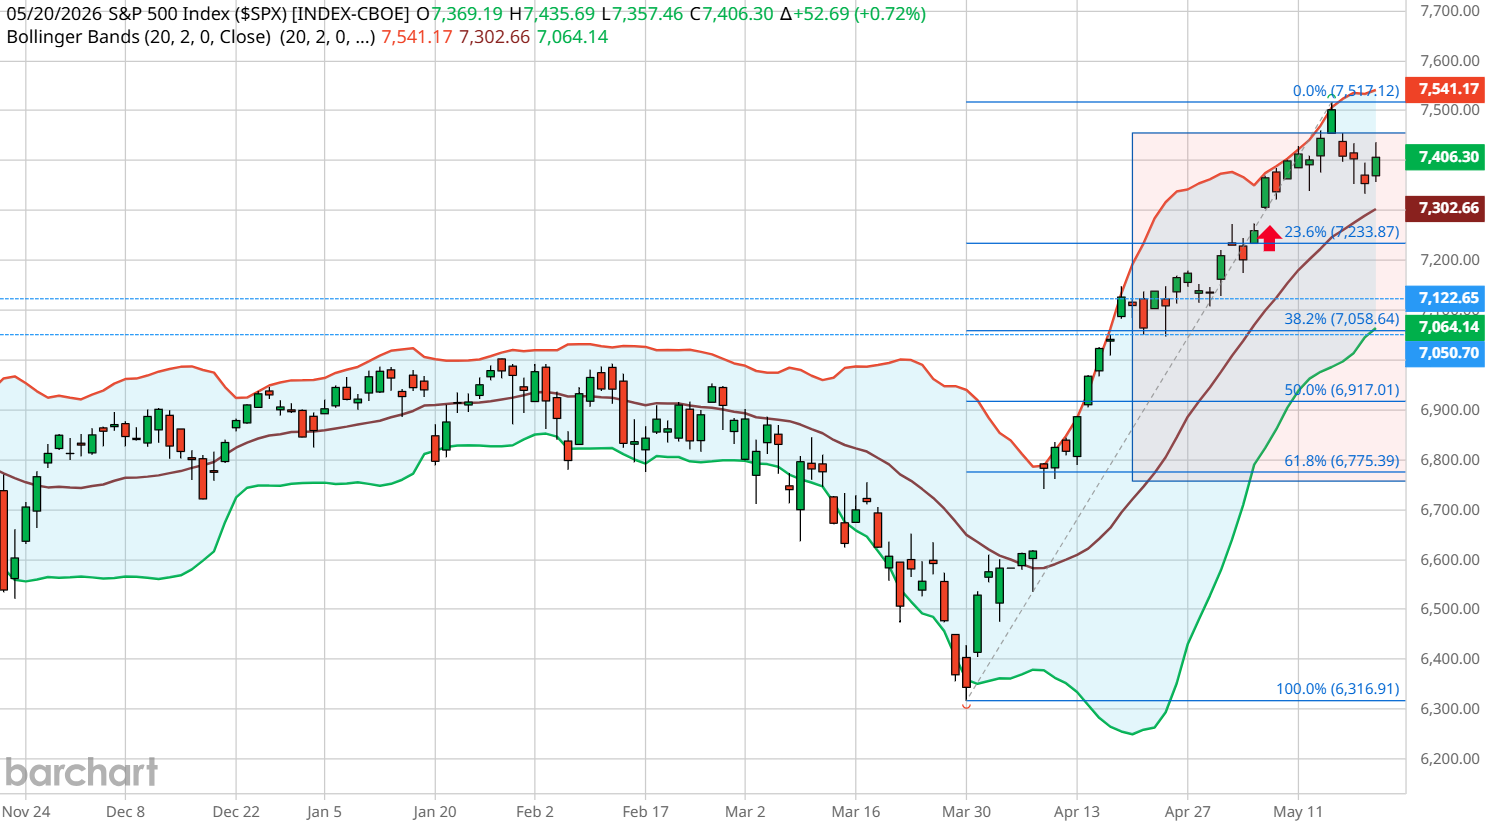
So, in the "playing field of probability," the current market action suggests it is highly likely we will return to the mean and fill the gap.
However, if you believe in waves and cycles, the lower Bollinger band and the 38% Fibonacci level are definitely within the realm of probability. That would be only a 6.7% corrective move from the top, which would be common, healthy, and constructive for any bull market.
– John Rowland, CMT, is Barchart’s Senior Market Strategist and host of Market on Close.
On the date of publication, Barchart Insights did not have (either directly or indirectly) positions in any of the securities mentioned in this article. All information and data in this article is solely for informational purposes. For more information please view the Barchart Disclosure Policy here.
More news from Barchart
- Don’t Panic, Says Our Top Technical Strategist. The Charts Say an S&P Pullback from Here Could Be Constructive.
- Consumer Staples Are Losing Their Safe-Haven Status. Here's Why.
- The $43 Billion ETF Hiding in Plain Sight. Why DIA Might Outperform SPY and QQQ for the Rest of 2026.
- The VIX and SPY Are Falling at the Same Time. Don’t Get Trapped by Volatility Hiding in a Market Blind Spot.