State Farm Ranks Highest among Large Insurers; The Hartford Ranks Highest among Midsize Insurers
Auto insurers are caught between a rock and a hard place. On one side: runaway demand in used vehicles that drove prices up an average of 41% in 2021, pushing vehicle replacement and repair costs into uncharted territory. On the other: frustrated customers, disillusioned by the rate increases insurers have introduced to confront these rising costs, who are now shopping for better policies that are more personalized to their own risk. According to the J.D. Power 2022 U.S. Insurance Shopping Study,SM released today, auto insurance customer satisfaction with price has plummeted, driving a surge in new-policy shopping activity while also dragging on the purchase experience index.
This press release features multimedia. View the full release here: https://www.businesswire.com/news/home/20220523005075/en/
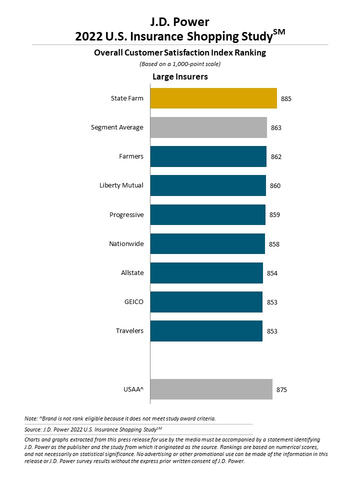
J.D. Power 2022 U.S. Insurance Shopping Study (Graphic: Business Wire)
“A perfect storm of record-high replacement costs, increased frequency and severity of collisions and an economic outlook that suggests this situation won’t change anytime soon is forcing a major industry disruption,” said Marty Ellingsworth, executive managing director of P&C insurance intelligence at J.D. Power. “In the near term, that disruption is manifesting itself in very low customer satisfaction with price and high rates of new policy shopping. Longer term, this may be the catalyst to significant adoption of usage-based insurance, which may be the only way insurers can navigate the financial realities while still managing to engage with customers and build loyalty by meeting their specific needs.”
Following are some key findings of the 2022 study:
- Auto insurance customer satisfaction falls: The average overall satisfaction score among auto insurance shoppers is 862 (on a 1,000-point scale), down 6 points from a year ago. All told, six of nine large insurers and six of 11 midsize insurers see decreases in purchase experience satisfaction scores this year.
- Price hikes spur new policy shopping rates: Shopping rates were down in early 2022, compared with 2021, but recent rate increases seen in March and April of 2022 are pushing shopping rates back to historical norms.1 The largest drivers of new policy shopping for retained and switched shoppers are proactive price checking (51%) and rate increases (35%). Among those who are shopping for a new policy because of a rate hike, 64% experienced a price increase of 11% or more.
- Direct insurers see customer satisfaction meet a cliff: The direct insurer channel reversed course after several straight years of steadily increasing customer satisfaction to fall 17 points this year. The overall satisfaction score for the direct channel is 860, which puts it behind the exclusive agent channel (866) for the first time in five years. The independent agent channel climbs to 854 from 848 a year ago, but still lags direct and exclusive agent channels in overall customer satisfaction.
- Older customers more price sensitive: As customers age, they are more likely to shop for insurance due to price factors. Among Pre-Boomers,2 for example, 67% of insurance shopping is driven by price. By contrast, among Gen Z, 41% of shoppers are price driven.
Study Rankings
State Farm ranks highest among large auto insurers in providing a satisfying purchase experience, with a score of 885. The segment average is 863.
The Hartford ranks highest among midsize auto insurers, with a score of 889. Erie Insurance (878) ranks second and Amica Mutual (874) ranks third. The segment average is 855.
Now in its 16th year, the U.S. Insurance Shopping Study captures advanced insight into each stage of the shopping funnel and is based on responses from 10,804 insurance customers who requested an auto insurance price quote from at least one competitive insurer in the previous nine months. The study was fielded from March 2021 through January 2022.
For more information about the U.S. Insurance Shopping Study, visit
https://www.jdpower.com/business/resource/jd-power-us-insurance-shopping-study.
See the online press release at http://www.jdpower.com/pr-id/2022036.
About J.D. Power
J.D. Power is a global leader in consumer insights, advisory services and data and analytics. A pioneer in the use of big data, artificial intelligence (AI) and algorithmic modeling capabilities to understand consumer behavior, J.D. Power has been delivering incisive industry intelligence on customer interactions with brands and products for more than 50 years. The world's leading businesses across major industries rely on J.D. Power to guide their customer-facing strategies.
J.D. Power has offices in North America, Europe and Asia Pacific. To learn more about the company’s business offerings, visit JDPower.com/business. The J.D. Power auto shopping tool can be found at JDPower.com.
About J.D. Power and Advertising/Promotional Rules: www.jdpower.com/business/about-us/press-release-info
_________________________
1 J.D. Power Auto Insurance Loyalty Indicator and Shopping Trends (LIST)
2 J.D. Power defines generational groups as Pre-Boomers (born before 1946); Boomers (1946-1964); Gen X (1965-1976); Gen Y (1977-1994); and Gen Z (1995-2004). Millennials (1982-1994) are a subset of Gen Y.
View source version on businesswire.com: https://www.businesswire.com/news/home/20220523005075/en/
Contacts
Media Relations Contacts
Geno Effler, J.D. Power; West Coast; 714-621-6224; media.relations@jdpa.com
John Roderick; East Coast; 631-584-2200; john@jroderick.com