State Farm Ranks Highest among Large Insurers in Providing Satisfying Shopping Experience; The Hartford Ranks Highest among Midsize Insurers
The nation’s auto insurers are locked in a vicious cycle of inflation, rising premiums and steadily increasing customer defection rates. The result, according to the J.D. Power 2023 U.S. Insurance Shopping Study,SM released today, is a sharper focus on saving money as large numbers of auto insurance customers shop for new policies and switch to new carriers, largely based on price.
This press release features multimedia. View the full release here: https://www.businesswire.com/news/home/20230427005035/en/
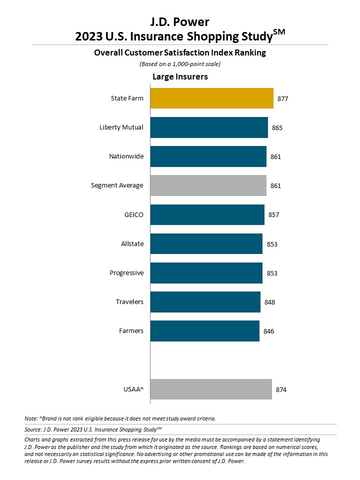
J.D. Power 2023 U.S. Insurance Shopping Study (Graphic: Business Wire)
“Auto insurance customers are starting to shop for insurance like they shop for gas,” said Stephen Crewdson, senior director, insurance business intelligence at J.D. Power. “They are taking a much more active stance in seeking out plans that fit their needs and their budgets, which could have a serious long-term effect on carriers that have been working for years to build lifetime value through bundling and other initiatives. In the near term, this shopping trend manifests itself in increased customer interest in usage-based insurance (UBI) plans and some reshuffling of market share among the top carriers.”
Following are some key findings of the 2023 study:
- Auto insurance shopping increases while customer satisfaction stagnates: Average overall satisfaction among auto insurance shoppers is 861 (on a 1,000-point scale), which is flat from a year ago, even though shopping and switching rates have increased in the same period. The 30-day average shopping rate reached 13.1% in March 2023, the highest rate since June 2021 and well above the 2021 average of 11.4%. The 30-day average switch rate hit 4.1% in March 2023, which compares to an average of 3.4% for all of 2021.
- Price hikes spur new-policy shopping rates: Auto insurance costs rose 14.5% in February 2023, more than twice the rate of inflation (6%), making auto insurance account for a steadily increasing share of consumer discretionary spending. Accordingly, among those shopping for reasons of price, 44% say they are price checking and 42% say they are being spurred by a rate increase. Similarly, 41% of those shopping because of a rate increase say that their rate increased 20% or more.
- UBI starts to go mainstream: UBI programs, which use telematics software to monitor a customer’s driving style and assign rates based on safety and mileage metrics, are now offered to 22% of insurance shoppers and are purchased 18% of the time. Those numbers are up from a 16% offer rate and a 12% purchase rate in 2020. When carriers offer a UBI option, customer satisfaction increases 6 points.
- Progressive gains market share as GEICO slows: GEICO raised its rates significantly above industry average throughout much of the second half of 2022 while Progressive raised rates in the first quarter of 2022 and then registered lower-than-average increases during the second half of the year. During the same period, Progressive posted a notable gain in market share, becoming the second-largest auto insurer in the United States, ahead of GEICO and behind State Farm.
Study Rankings
State Farm ranks highest among large auto insurers in providing a satisfying purchase experience for a third consecutive year, with a score of 877. Liberty Mutual (865) ranks second and Nationwide (861) ranks third. The segment average is 861.
The Hartford ranks highest among midsize auto insurers for a second consecutive year, with a score of 887. Erie Insurance (878) ranks second and Automobile Club of Southern California (AAA) (870) ranks third. The segment average is 863.
Large insurers have direct premiums written of $4.5 billion or more in personal lines auto, while midsize insurers have direct premiums written of $1 billion-$4.499 billion in personal lines auto.
Now in its 17th year, the U.S. Insurance Shopping Study captures advanced insight into each stage of the shopping funnel and is based on responses from 10,845 insurance customers who requested an auto insurance price quote from at least one competitive insurer in the previous nine months. The study was fielded from March 2022 through January 2023.
For more information about the U.S. Insurance Shopping Study, visit https://www.jdpower.com/business/resource/jd-power-us-insurance-shopping-study.
See the online press release at http://www.jdpower.com/pr-id/2023036.
About J.D. Power
J.D. Power is a global leader in consumer insights, advisory services and data and analytics. A pioneer in the use of big data, artificial intelligence (AI) and algorithmic modeling capabilities to understand consumer behavior, J.D. Power has been delivering incisive industry intelligence on customer interactions with brands and products for more than 50 years. The world's leading businesses across major industries rely on J.D. Power to guide their customer-facing strategies.
J.D. Power has offices in North America, Europe and Asia Pacific. To learn more about the company’s business offerings, visit JDPower.com/business. The J.D. Power auto shopping tool can be found at JDPower.com.
About J.D. Power and Advertising/Promotional Rules: www.jdpower.com/business/about-us/press-release-info
View source version on businesswire.com: https://www.businesswire.com/news/home/20230427005035/en/
Contacts
Geno Effler, J.D. Power; West Coast; 714-621-6224; media.relations@jdpa.com
John Roderick; East Coast; 631-584-2200; john@jroderick.com