Schwab clients were net buyers of equities overall, but on a dollar basis they continued to rotate out of individual equities and into ETFs, mutual funds, and fixed income securities
The Schwab Trading Activity Index™ (STAX) increased to 48.37 in October, up from its score of 47.10 in September. The only index of its kind, the STAX is a proprietary, behavior-based index that analyzes retail investor stock positions and trading activity from Schwab’s millions of client accounts to illuminate what investors were actually doing and how they were positioned in the markets each month.
This press release features multimedia. View the full release here: https://www.businesswire.com/news/home/20241104496526/en/
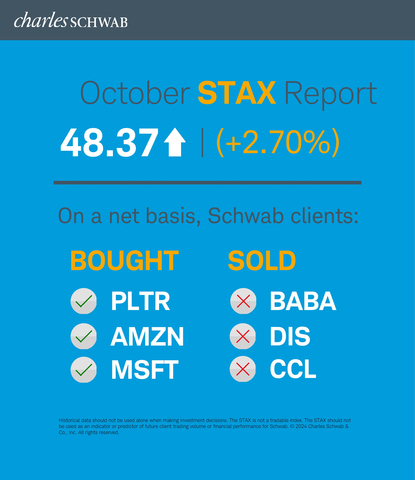
Schwab Trading Activity Index October 2024 (Graphic: Charles Schwab)
The reading for the four-week period ending October 25, 2024, ranks “moderate low” compared to historic averages.
“Earnings season has arrived once again, and the EPS ‘beat rate’ for companies that have reported thus far hovers around 79%, which is slightly better than expected,” said Joe Mazzola, Head Trading & Derivatives Strategist at Charles Schwab. “Analysts had lowered S&P 500 earnings estimates for Q3, expecting year-over-year growth of 4.2%, so while the beat rate is notable, the bar was also lower. At the top line, companies’ revenue beat rate appears softer than expected, tracking just above 59%. This points to cost cutting and margin expansion as the current primary drivers to earnings growth this quarter. Leadership rotation has helped the indices preserve bullish trends, but clients continue to de-risk at the single-stock level, as they rebalance equity portfolios as well as rotate into fixed income.”
In October, Schwab clients sold strength in some banking and fintech companies and reduced exposure to select companies that operate in retail, travel, and hospitality. Schwab clients remained very interested in the prospects of Artificial Intelligence (AI) and were net buyers in this space. However, a notable callout is that Nvidia (NVDA), synonymous with AI, didn’t finish the month as a net top five buy for the first time since November 2023, even though it was one of the most actively traded stocks. Activity in NVDA, on both the buy and sell side, was so evenly matched that on a net basis it evened out.
More clients were net buyers of equities than net sellers during the October STAX period; however, clients continued to rotate out of individual equities and into ETFs, mutual funds, and fixed income securities, suggesting the trend towards diversification and de-risking continues, though not to the same degree as the previous month.
All three major U.S. stock indices made new 52-week and all-time-highs during the October STAX period, which was notable considering the backdrop of rapidly ascending interest rates. The 10-year yield finished the STAX period 40-basis points higher. Improving economic data and a better-than-expected start to the earnings season perhaps played a part in bolstering market confidence. Overall, leadership rotation has helped the indices to preserve bullish trends. On a sector basis, clients were net buyers of Health Care, Utilities, and Consumer Discretionary. Selling was most pronounced in Information Technology, Financials, and Energy.
Economic data, for the most part, showed improvement throughout the period, and markets primarily reacted well to data. The U.S. Bureau of Labor and Statistics released its Employment Situation Summary on October 4, which showed non-farm payrolls increasing by 254,000, beating expectations by more than 100,000. The unemployment rate fell slightly to 4.1%. The S&P 500 traded up by more than 50 points following the data release. On October 10, the Consumer Price Index (CPI) came in better than expected at 2.4% for the trailing 12 months and the Producer Price Index (PPI) was unchanged and in-line with expectations. The S&P 500 traded 12 points lower the day of the data release but rose by 35 points the following day. Final second quarter Gross Domestic Product (GDP) was in-line at 3%; the primary drivers were increased consumer and federal government spending, as well as exports.
The CBOE Volatility Index® (VIX) moved higher in October and closed the period up 19.87%. The 10-year Treasury yield closed at 4.23%. The U.S. Dollar Index also rose, closing 3.82% higher at 104.26. Front month WTI Crude Oil futures rose sharply in the first half of the period, moderated in the second half, and closed up 5.28%.
Popular names bought by Schwab clients during the period included:
- Palantir Technologies Inc. (PLTR)
- Amazon.com Inc. (AMZN)
- Microsoft Corp. (MSFT)
- Advanced Micro Devices Inc. (AMD)
- Meta Platforms Inc. (META)
Names net sold by Schwab clients during the period included:
- Alibaba Group Holding Ltd. (BABA)
- Walt Disney Co. (DIS)
- Carnival Corp. (CCL)
- Bank of America Corp. (BAC)
- SoFi Technologies Inc. (SOFI)
About the STAX
The STAX value is calculated based on a complex proprietary formula. Each month, Schwab pulls a sample from its client base of millions of funded accounts, which includes accounts that completed a trade in the past month. The holdings and positions of this statistically significant sample are evaluated to calculate individual scores, and the median of those scores represents the monthly STAX.
For more information on the Schwab Trading Activity Index, please visit www.schwab.com/investment-research/stax. Additionally, Schwab clients can chart the STAX using the symbol $STAX in either the thinkorswim® or thinkorswim Mobile platforms.
Investing involves risk, including loss of principal. Past performance is no guarantee of future results. Content intended for educational/informational purposes only. Not investment advice, or a recommendation of any security, strategy, or account type.
Historical data should not be used alone when making investment decisions. Please consult other sources of information and consider your individual financial position and goals before making an independent investment decision.
The STAX is not a tradable index. The STAX should not be used as an indicator or predictor of future client trading volume or financial performance for Schwab.
About Charles Schwab
At Charles Schwab, we believe in the power of investing to help individuals create a better tomorrow. We have a history of challenging the status quo in our industry, innovating in ways that benefit investors and the advisors and employers who serve them, and championing our clients’ goals with passion and integrity.
More information is available at aboutschwab.com. Follow us on X, Facebook, YouTube, and LinkedIn.
1124-3B9T
View source version on businesswire.com: https://www.businesswire.com/news/home/20241104496526/en/
Contacts
At the Company
Margaret Farrell
Director, Corporate Communications
(203) 434-2240
margaret.farrell@schwab.com


