More Schwab clients net bought equities than net sold, with the most buying in the Information Technology, Health Care, and Consumer Staples sectors. Selling was most pronounced in Communication Services, Financials, and Consumer Discretionary.
The Schwab Trading Activity Index™ (STAX) increased to 49.22 in November, up from its score of 48.37 in October. The only index of its kind, the STAX is a proprietary, behavior-based index that analyzes retail investor stock positions and trading activity from Schwab’s millions of client accounts to illuminate what investors were actually doing and how they were positioned in the markets each month.
This press release features multimedia. View the full release here: https://www.businesswire.com/news/home/20241209563932/en/
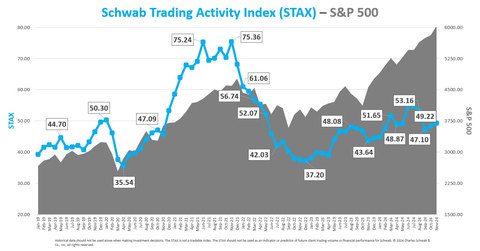
Schwab Trading Activity Index vs. S&P 500 (Graphic: Charles Schwab)
The reading for the five-week period ending November 29, 2024, ranks “moderate low” compared to historic averages.
“In November, as the outcome of the U.S. election came swiftly into view and the Fed announced another interest rate cut, more clients were net buyers of equities than net sellers. However, we continued to see big rotations,” said Joe Mazzola, Head Trading & Derivatives Strategist at Charles Schwab. “On a dollar basis, Schwab’s clients were in fact net sellers of equities as they continued to purchase ETFs, mutual funds, treasuries, and other fixed income securities. As we continue into December investors may weigh their holiday and end-of-year spending, consider 2024 tax deadlines, and anticipate a likely continuation of rate cuts from the Fed.”
With Fed announcements and elections now in the rear-view, some uncertainty and market volatility may have abated, as reflected by a jump in equities and a fall in the CBOE Volatility Index® (VIX). For much of the STAX period, interest rates and stock prices moved in tandem, but that relationship reversed in the final weeks as rates dropped and stocks continued to rise. All three major U.S. stock indices reached new all-time highs once again during the November STAX period. A hallmark of the rally in equities has been its breadth, with most stocks in the major indices sustaining prices above their 200-day moving average.
The U.S. Bureau of Labor Statistics’ Employment Situation Summary released on November 1 showed both non-farm payrolls and the unemployment rate (4.1%) were unchanged, and the S&P 500 advanced just shy of 25 points following the release. On November 7, the Federal Open Market Committee (FOMC) and its chairman, Jerome Powell, announced a 25-basis point cut in the Fed Funds rate and delivered comments suggesting that the Fed is prioritizing its full employment mandate over its price stability mandate. On November 13, the Consumer Price Index (CPI) came in as expected at 2.6% for the trailing 12 months, and the following day, the Producer Price Index (PPI) was reported as 0.2% (in-line with expectations). The S&P 500 traded 35 points lower the day of the PPI release and slid by another 80 points the following day as treasuries fell and yields traded at a six-month high of 4.50%. Rounding out the period, the third quarter Gross Domestic Product (GDP) came in as expected at 2.8%.
The VIX fell by 26% in November and closed the period at 13.49. The 10-year Treasury yield closed at 4.172%. The U.S. Dollar Index also continued to strengthen, rising 1.62% to 105.62. Front month WTI Crude Oil futures fell by 5.27%, ending the period at $68.00 per contract.
Popular names bought by Schwab clients during the period included:
- NVIDIA Corp. (NVDA)
- Palantir Technologies Inc. (PLTR)
- Advanced Micro Devices Inc. (AMD)
- Super Micro Computer Inc. (SMCI)
- MicroStrategy Inc. (MSTR)
Names net sold by Schwab clients during the period included:
- Apple Inc. (AAPL)
- Walt Disney Co. (DIS)
- Tesla Inc. (TSLA)
- Bank of America Corp. (BAC)
- Ford Motor Co. (F)
About the STAX
The STAX value is calculated based on a complex proprietary formula. Each month, Schwab pulls a sample from its client base of millions of funded accounts, which includes accounts that completed a trade in the past month. The holdings and positions of this statistically significant sample are evaluated to calculate individual scores, and the median of those scores represents the monthly STAX.
For more information on the Schwab Trading Activity Index, please visit www.schwab.com/investment-research/stax. Additionally, Schwab clients can chart the STAX using the symbol $STAX in either the thinkorswim® or thinkorswim Mobile platforms.
Investing involves risk, including loss of principal. Past performance is no guarantee of future results. Content intended for educational/informational purposes only. Not investment advice, or a recommendation of any security, strategy, or account type.
Historical data should not be used alone when making investment decisions. Please consult other sources of information and consider your individual financial position and goals before making an independent investment decision.
The STAX is not a tradable index. The STAX should not be used as an indicator or predictor of future client trading volume or financial performance for Schwab.
About Charles Schwab
At Charles Schwab, we believe in the power of investing to help individuals create a better tomorrow. We have a history of challenging the status quo in our industry, innovating in ways that benefit investors and the advisors and employers who serve them, and championing our clients’ goals with passion and integrity.
More information is available at aboutschwab.com. Follow us on X, Facebook, YouTube, and LinkedIn.
1224-A2P3
View source version on businesswire.com: https://www.businesswire.com/news/home/20241209563932/en/
Contacts
At the Company
Margaret Farrell
Director, Corporate Communications
(203) 434-2240
margaret.farrell@schwab.com


