Schwab clients were net buyers in January, with the most pronounced buying within the Consumer Discretionary, Energy and Health Care sectors
The Schwab Trading Activity Index™ (STAX) increased to 44.73 in January, up slightly from its score of 44.56 in December. The STAX is a proprietary, behavior-based index that analyzes retail investor stock positions and trading activity to illuminate what investors were actually doing and how they were positioned in the markets each month.
This press release features multimedia. View the full release here: https://www.businesswire.com/news/home/20240205765717/en/
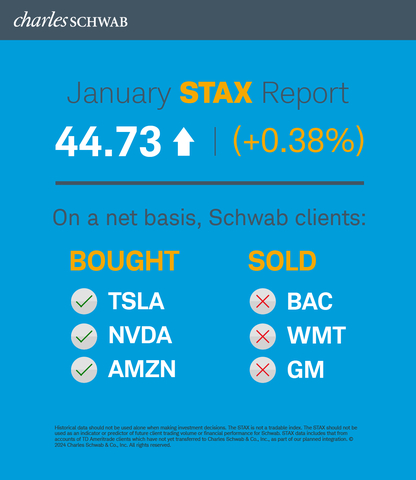
Schwab Trading Activity Index January 2024 (Graphic: Charles Schwab)
The reading for the four-week period ending January 26, 2023 ranks “moderate low” compared to historic averages.
“Schwab’s clients were net buyers of equities in January,” said Joe Mazzola, Director of Trading and Education at Charles Schwab. “While exposure was still relatively low when viewed in a historical context, we saw that for the most part, our clients stayed in step with the market rally, finding opportunities to increase exposure in particular to the ‘Magnificent Seven’ companies as the new year began.”
U.S. equity markets picked up right where they left off last year, posting solid gains during the January STAX period. Economic data supported the rally. The U.S. Bureau of Labor and Statistics’ Employment Situation Summary released on January 5 showed that nonfarm payrolls increased by 216,000 in December, which was better than expected. The unemployment rate was unchanged at 3.7%. On January 11, it was reported that the Consumer Price Index (CPI) rose by 0.3% for the month of December to 3.4% year-over-year, slightly hotter than expected. Later in the month, the U.S. Bureau of Economic Analysis released its first estimate of fourth quarter Gross Domestic Product (GDP), and the release showed an annualized growth rate of 3.3% during the quarter. While this was a notable slowdown from the third quarter rate of 4.9%, it was much better than the street forecast of 2%. This more resilient economic picture pushed back on the market’s anticipation of significant monetary easing in 2024.
During the January STAX period, the S&P 500 (SPX) continued to reach new heights, with a rise of 2.54% to close at 4890.97. The CBOE Volatility Index (VIX) inched higher from 12.45 to 13.26, reflecting an increase in risk premium, though it remained low by historical measures. The 10-year Treasury yield rose to 4.14%, reversing from its recent trend lower. The U.S. Dollar Index strengthened during the period, ending at 103.43. March Crude Oil Futures moved 8.9% higher, settling at $78.01 per barrel.
Popular names bought by Schwab clients during the period included:
- Tesla Inc. (TSLA)
- NVIDIA Corp. (NVDA)
- Amazon.com Inc. (AMZN)
- Microsoft Corp. (MSFT)
- Advanced Micro Devices (AMD)
Names net sold by Schwab clients during the period included:
- Bank of America Corp. (BAC)
- Walmart Inc. (WMT)
- General Motors Co. (GM)
- Carnival Corp. (CCL)
- Warner Bros. Discovery Inc. (WBD)
About the STAX
The STAX value is calculated based on a complex proprietary formula. Each month, Schwab pulls a sample from its client base of funded accounts, which includes accounts that completed a trade in the past month. The holdings and positions of this statistically significant sample are evaluated to calculate individual scores, and the median of those scores represents the monthly STAX.
For more information on the Schwab Trading Activity Index, please visit www.schwab.com/investment-research/stax. Additionally, Schwab clients can chart the STAX using the symbol $STAX in either the thinkorswim® or thinkorswim Mobile platforms.
Investing involves risk, including loss of principal. Past performance is no guarantee of future results.
Content intended for educational/informational purposes only. Not investment advice, or a recommendation of any security, strategy, or account type.
Historical data should not be used alone when making investment decisions. Please consult other sources of information and consider your individual financial position and goals before making an independent investment decision.
The STAX is not a tradable index. The STAX should not be used as an indicator or predictor of future client trading volume or financial performance for Schwab. STAX data includes that from accounts of TD Ameritrade clients which have not yet transferred to Charles Schwab & Co., Inc., as part of our planned integration.
TD Ameritrade, Inc., member FINRA/SIPC, a subsidiary of The Charles Schwab Corporation. TD Ameritrade is a trademark jointly owned by TD Ameritrade IP Company, Inc. and The Toronto-Dominion Bank.
About Charles Schwab
At Charles Schwab, we believe in the power of investing to help individuals create a better tomorrow. We have a history of challenging the status quo in our industry, innovating in ways that benefit investors and the advisors and employers who serve them, and championing our clients’ goals with passion and integrity.
More information is available at aboutschwab.com. Follow us on X, Facebook, YouTube, and LinkedIn.
0224-GZVW
View source version on businesswire.com: https://www.businesswire.com/news/home/20240205765717/en/
Contacts
At the Company
Margaret Farrell
Director, Corporate Communications
(203) 434-2240
margaret.farrell@schwab.com


