Schwab clients were net buyers in June, increasing their exposure in information technology, consumer discretionary and consumer staples
The Schwab Trading Activity Index™ (STAX) increased to 54.71 in June, up from its score of 49.05 in May. The only index of its kind, the STAX is a proprietary, behavior-based index that analyzes retail investor stock positions and trading activity from Schwab’s millions of client accounts to illuminate what investors were actually doing and how they were positioned in the markets each month.
This press release features multimedia. View the full release here: https://www.businesswire.com/news/home/20240708835055/en/
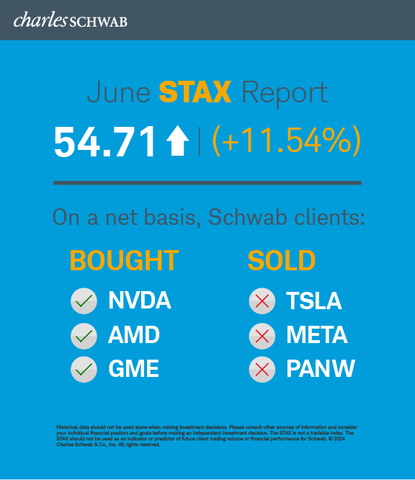
Schwab Trading Activity Index June 2024 (Graphic: Charles Schwab)
The reading for the four-week period ending June 28, 2024, ranks “moderate” compared to historic averages.
“Interestingly, unlike last month, excitement appeared to build around ‘meme stocks’ during the June STAX period and we saw that reflected in the month’s top buys across the general STAX population,” said Joe Mazzola, Head Trading & Derivatives Strategist at Charles Schwab. “We’ll need to see whether that trend extends into July. On the whole, though, Schwab clients were net buyers of equities in June as they increased exposure to technology-related names and particularly those that are part of the increasing wave of interest in Artificial Intelligence (AI).”
During the June STAX period U.S. equity markets added to gains from the previous period. Fears of stagflation appeared to lessen in June, and on June 28, the final day of the June STAX period, both the S&P 500 and Nasdaq Composite posted new all-time highs, powered by continued trader and investor interest in AI themes. The CBOE Volatility Index (VIX) dipped below 12 briefly, ending the period 3.72% lower at 12.44.
On June 7, the U.S. Bureau of Labor and Statistics’ Employment Situation Summary showed nonfarm payrolls increased by 272,000 in June, smashing the consensus estimate of 185,000. Even so, the unemployment rate edged higher to 4.0%. On June 20, initial jobless claims were in-line with expectations at 238,000, continuing their upward trajectory.
The June Consumer Price Index (CPI) and Producer Price Index (PPI) reports both came in below expectations, showing inflation cooling, but still above the Fed’s target goal of 2%. CPI came in at 0.2%, better than the 0.3% forecasted, while PPI declined by 0.2% but was still 2.2% higher than a year earlier. On June 27, Core Personal Consumption Expenditures (PCE) were reported at 2.6% versus expectations of 2.7%, and Q1 GDP slowed to an annual rate of 1.4%. The 10-year Treasury yield fell by more than 3% for a second straight month to close the period at 4.343. The U.S. Dollar Index rose by 1.15%, closing the period at 105.87, and front month Crude Oil Futures rose by 5.91% to close the June STAX period at $81.54 per barrel.
Popular names bought by Schwab clients during the period included:
- NVIDIA Corp. (NVDA)
- Advanced Micro Devices Inc. (AMD)
- GameStop Corp. (GME)
- Amazon.com Inc. (AMZN)
- Apple Inc. (AAPL)
Names net sold by Schwab clients during the period included:
- Tesla Inc. (TSLA)
- Meta Platforms Inc. (META)
- Palo Alto Networks Inc. (PANW)
- Walt Disney Co. (DIS)
- AT&T Inc. (T)
About the STAX
The STAX value is calculated based on a complex proprietary formula. Each month, Schwab pulls a sample from its client base of millions of funded accounts, which includes accounts that completed a trade in the past month. The holdings and positions of this statistically significant sample are evaluated to calculate individual scores, and the median of those scores represents the monthly STAX.
For more information on the Schwab Trading Activity Index, please visit www.schwab.com/investment-research/stax. Additionally, Schwab clients can chart the STAX using the symbol $STAX in either the thinkorswim® or thinkorswim Mobile platforms.
Investing involves risk, including loss of principal. Past performance is no guarantee of future results.
Content intended for educational/informational purposes only. Not investment advice, or a recommendation of any security, strategy, or account type.
Historical data should not be used alone when making investment decisions. Please consult other sources of information and consider your individual financial position and goals before making an independent investment decision.
The STAX is not a tradable index. The STAX should not be used as an indicator or predictor of future client trading volume or financial performance for Schwab.
About Charles Schwab
At Charles Schwab, we believe in the power of investing to help individuals create a better tomorrow. We have a history of challenging the status quo in our industry, innovating in ways that benefit investors and the advisors and employers who serve them, and championing our clients’ goals with passion and integrity.
More information is available at aboutschwab.com. Follow us on X, Facebook, YouTube, and LinkedIn.
0724-BMMA
View source version on businesswire.com: https://www.businesswire.com/news/home/20240708835055/en/
Contacts
At the Company
Margaret Farrell
Director, Corporate Communications
(203) 434-2240
margaret.farrell@schwab.com


