Schwab clients were net sellers of equities overall and across the Communication Services, Health Care and Information Technology sectors in August; they net bought Consumer Discretionary and Energy
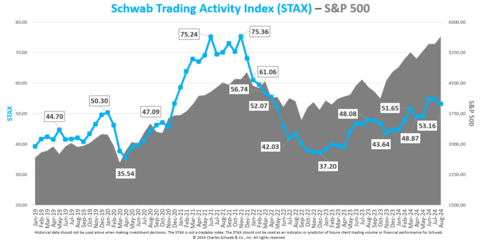
The Schwab Trading Activity Index™ (STAX) decreased to 53.16 in August, down from its score of 54.81 in July. The only index of its kind, the STAX is a proprietary, behavior-based index that analyzes retail investor stock positions and trading activity from Schwab’s millions of client accounts to illuminate what investors were actually doing and how they were positioned in the markets each month.
This press release features multimedia. View the full release here: https://www.businesswire.com/news/home/20240909081610/en/
Schwab Trading Activity Index vs. S&P 500 (Graphic: Charles Schwab)
The reading for the five-week period ending August 30, 2024, ranks “moderate” compared to historic averages.
“Schwab clients appeared to rotate out of equities and into fixed income securities as a means of de-risking, which pushed the overall STAX score lower this month,” said Joe Mazzola, Head Trading & Derivatives Strategist at Charles Schwab. “While the August trading period started with a bang on August 5 – a day that’s been called a ‘meltdown’ or ‘crash’ by many – the markets recovered remarkably quickly, and, despite net selling overall, we did see many Schwab clients using the volatility to their advantage and taking the opportunity to buy the dip.”
Volatility in equity markets persisted throughout the August STAX period. However, major indices did notch multi-day winning streaks, and the Dow Jones Industrial Average made a new high of 41,585.21 on the last day of the period, August 30. The “yen carry trade” was still in play in early August following the Bank of Japan’s raise of 15 basis points on July 31. Once the unwind completed, it likely reduced some of the selling pressure on U.S. equities. U.S. equity markets did experience another significant sell-off in late August, following some softer than expected jobs data.
On August 1, initial jobless claims came in at 249,000, slightly higher than expected. By itself, this metric is not enough to signal a softening labor market. However, the Federal Open Market Committee (FOMC) just one day prior noted that enough data points from recent months have pointed to progress towards employment and inflation targets and that a pivot towards easing of interest rates is imminent, with the announcement of a rate cut anticipated in September. The U.S. Bureau of Labor and Statistics released the Employment Situation Summary on August 2, which stated that the unemployment rate rose to 4.3% and non-farm payrolls rose by 114,000. Both metrics missed consensus estimates.
Both the Consumer Price Index (CPI) and Producer Price Index (PPI) came in just below expectations at 2.9% (for the trailing 12 months) and 0.1%, respectively. Finally, Q2 Gross Domestic Product (GDP) estimates were raised to three percent versus real Q1 GDP of 1.4%; as was reported last period, the drivers are increased consumer spending and increases in business and inventory investments.
The CBOE Volatility Index (VIX) did experience another 50% spike early in the August STAX period, but then moderated, closing 9.82% lower at 14.78. The 10-year Treasury yield fell by 6.88% to close the period at 3.911%. The US Dollar Index declined throughout August, closing at 101.70, down 2.51%. As supply increases outpaced demand, front month Crude Oil futures fell by 4.68% to close the period at $73.55 per contract.
Popular names bought by Schwab clients during the period included:
- NVIDIA Corp. (NVDA)
- Amazon.com Inc. (AMZN)
- Intel Corp. (INTC)
- Microsoft Corp. (MSFT)
- Advanced Micro Devices Inc. (AMD)
Names net sold by Schwab clients during the period included:
- Meta Platforms Inc. (META)
- Apple Inc. (AAPL)
- Starbucks Corp. (SBUX)
- PayPal Holdings Inc. (PYPL)
- Palo Alto Networks Inc. (PANW)
About the STAX
The STAX value is calculated based on a complex proprietary formula. Each month, Schwab pulls a sample from its client base of millions of funded accounts, which includes accounts that completed a trade in the past month. The holdings and positions of this statistically significant sample are evaluated to calculate individual scores, and the median of those scores represents the monthly STAX.
For more information on the Schwab Trading Activity Index, please visit www.schwab.com/investment-research/stax. Additionally, Schwab clients can chart the STAX using the symbol $STAX in either the thinkorswim® or thinkorswim Mobile platforms.
Investing involves risk, including loss of principal. Past performance is no guarantee of future results.
Content intended for educational/informational purposes only. Not investment advice, or a recommendation of any security, strategy, or account type.
Historical data should not be used alone when making investment decisions. Please consult other sources of information and consider your individual financial position and goals before making an independent investment decision.
The STAX is not a tradable index. The STAX should not be used as an indicator or predictor of future client trading volume or financial performance for Schwab.
About Charles Schwab
At Charles Schwab, we believe in the power of investing to help individuals create a better tomorrow. We have a history of challenging the status quo in our industry, innovating in ways that benefit investors and the advisors and employers who serve them, and championing our clients’ goals with passion and integrity.
More information is available at aboutschwab.com. Follow us on X, Facebook, YouTube, and LinkedIn.
0924-REDG
View source version on businesswire.com: https://www.businesswire.com/news/home/20240909081610/en/
Contacts
At the Company
Margaret Farrell
Director, Corporate Communications
(203) 434-2240
margaret.farrell@schwab.com


