National rent growth decelerates as supply pressures persist
Today, Apartments.com, an industry-leading online marketplace of CoStar Group (NASDAQ: CSGP), published its latest report on multifamily rent trends for August 2025.
This press release features multimedia. View the full release here: https://www.businesswire.com/news/home/20250905379330/en/
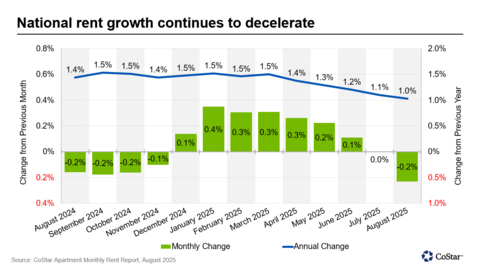
National rent growth continues to decelerate
U.S. apartment rents declined in August, with the national average falling to $1,713 — a 0.23% decrease from July’s revised rent of $1,719. This marks the second consecutive month of flat or negative monthly rent change and the first time since January that the national average has declined by more than 20 basis points. Annual rent growth slowed further to 1.0%, down from 1.1% in July and 1.5% at the start of the year.
Apartment rent growth typically follows a seasonal pattern, with acceleration in the spring and a slowdown in late summer and fall. While month-over-month declines are expected during this period, the recent year-over-year slowdown—which adjusts for seasonality—signals a more pronounced softening in the market. Notably, the decline in rents from their peak through August 2025 is sharper than in 2024, both in absolute dollars and in percentage terms, underscoring that this year's pullback exceeds typical seasonal patterns and reinforces the broader trend of moderation in rent growth.
Although the national average remains above levels from a year ago, elevated supply pressures continue to weigh on rent growth momentum. While the market hasn’t entered a widespread downturn, the August data highlights the delicate balance of rent growth as autumn approaches.
All regions posted rent declines in August, a shift from July when the Midwest and Northeast still showed modest gains. The West led the pullback with a -0.5% month-over-month decline, followed by the South at -0.4%. The Midwest and Northeast also turned negative, down -0.2% and -0.1%, respectively. On an annual basis, the Midwest (2.5%) and Northeast (2.2%) remain the strongest-performing regions, while the West is now down -1.3% year-over-year.
Metro-level performance softened seasonally, with only a handful of markets posting positive rent growth in August. San Francisco led all markets with a +0.6% month-over-month increase, followed by Orange County (+0.3%), Northern New Jersey (+0.1%), Norfolk (+0.0%), and New York (+0.0%). These gains were largely concentrated in coastal and gateway markets, many of which have seen limited new supply.
At the other end of the spectrum, Richmond posted the steepest monthly decline at -1.1%, followed by Austin (-1.1%), Las Vegas (-1.0%), and San Antonio (-0.9%). These Sun Belt markets continue to face elevated vacancy and aggressive new supply, which is putting downward pressure on rents.
Year-over-year trends also reflect this divide. San Francisco leads the nation with 6.2% annual rent growth, followed by Chicago (3.9%), San Jose (3.5%), and New York (2.8%). Meanwhile, Austin (-4.7%), Denver (-3.5%), and Phoenix (-3.1%) remain the weakest performers, with continued declines driven by oversupply outstripping very strong demand.
These patterns reinforce the broader trends: markets with the highest levels of new construction are seeing the weakest rent performance, while more supply-constrained metros — particularly in the Midwest and select coastal areas — continue to outperform.
Although many markets are now technically past their “peak supply,” a meaningful overhang of new inventory remains across much of the country.
About CoStar Group
CoStar Group (NASDAQ: CSGP) is a global leader in commercial real estate information, analytics, online marketplaces, and 3D digital twin technology. Founded in 1986, CoStar Group is dedicated to digitizing the world’s real estate, empowering all people to discover properties, insights, and connections that improve their businesses and lives.
CoStar Group’s major brands include CoStar, a leading global provider of commercial real estate data, analytics, and news; LoopNet, the most trafficked commercial real estate marketplace; Apartments.com, the leading platform for apartment rentals; and Homes.com, the fastest-growing residential real estate marketplace. CoStar Group’s industry-leading brands also include Matterport, a leading spatial data company whose platform turns buildings into data to make every space more valuable and accessible, STR, a global leader in hospitality data and benchmarking, Ten-X, an online platform for commercial real estate auctions and negotiated bids and OnTheMarket, a leading residential property portal in the United Kingdom.
CoStar Group’s websites attracted over 141 million average monthly unique visitors in the second quarter of 2025, serving clients around the world. Headquartered in Arlington, Virginia, CoStar Group is committed to transforming the real estate industry through innovative technology and comprehensive market intelligence. From time to time, we plan to utilize our corporate website as a channel of distribution for material company information. For more information, visit CoStarGroup.com.
View source version on businesswire.com: https://www.businesswire.com/news/home/20250905379330/en/
Contacts
Media Contact:
Matthew Blocher
Vice President, Corporate Marketing & Communications
CoStar Group
(202) 346-6775
mblocher@costar.com


