
The S&P 500 (NYSEARCA: SPY) is down (-17.67%) for 2022 as we head into the year-end rebalancing. Technically, the SPY is back in correction territory while the NASDAQ (NASDAQ: QQQ) which is down (-29%) is still in a bear market. The Dow Jones (NYSEARCA: DIA) has been the best-performing index down only (-8.2%) for the year. The SPY is well off its lows of $348.11 made on Oct. 13, 2022. It actually rebounded 17.77% off its lows to peak at $410 on Dec. 1, 2022, before pulling back down off its monthly downtrend line.
As investors partake in tax-loss harvesting strategies, it is important to take a look at what to expect from the S&P 500 in 2023 both from a fundamental and technical point of view. Some of the major catalysts this year had to do with inflation, the U.S. Federal Reserve (Fed) monetary policy, 10-year treasury yields, rising U.S. dollar, energy prices, the Russia-Ukraine conflict, and China’s zero-COVID restrictions.
Inflation and Jobs
The aggressive rate hikes by the Fed are starting to make an impact on inflation. Peak inflation rose to 9.1% in June and has since been on a falling trajectory as the October CPI fell to 7.7%. The markets are hoping for the Fed to not only slow down rate hikes but actually pivot toward rate cuts in 2023.
With inflation heading in the right direction, the jobs market is the next shoe that needs to drop. However, the past two jobs numbers came in way over expectations at 263,000 versus 200,000. In fact, the October jobs data was revised higher to 284,000 from 262,000 against 200,000 expectations. The unemployment rate did manage to bump up slightly to 3.7% from 3.5% in September 2022. Inflation is still far away from the Fed’s inflation target of 2%.
The FOMC into 2023
Chairman Powell would rather overshoot with aggressive rate hikes now so they can administer rate cuts afterward instead of falling behind the curve with wimpy rate hikes that fail to make an impact on inflation. True to form, the Fed has aggressively raised by 75 basis points for four consecutive meetings driving the fed funds rate to 4.00% heading into the final FOMC meeting of the year on December 13, 2022.
Chairman Powell has stated that smaller rate hikes for a longer period of time is possible to continue the falling trajectory of inflation. The next FOMC meeting is scheduled to conclude on Feb. 1, 2023, with a rate decision and press conference.
Mild 2023 Recession
Recessions are only apparent in the rearview mirror. The U.S. GDP did happen to hit a recession in 2022 with two consecutive quarters of falling GDP, but many analysts are calling for a mile recession in 2023. The inverted yield curve suggests it’s possible as it tends to foreshadow recessions from months up to a year ahead of time.
The 10-year Treasury yield rose to a high of 4.335% on Oct. 21, 2022, and has since fallen to 3.584% by Dec. 9, 2022, as it attempts to bounce.
It tends to move inversely with the SPY most of the time. The U.S. Dollar index also tends to move inversely with the SPY. It peaked at $114.68 on Sept. 28, 2022. It has since fallen to $104.58 on Dec. 9, 2022. This also appears to be attempting to bounce. Using the trajectories of treasury bond yields and the U.S. dollar index can provide a reference point for the inverse trajectory of the SPY.
China and Russia
China’s hardline stance of its zero-COVID policy that has kept the country restrained for three years has taken a surprise reversal as it continues to relax restrictions. The re-opening of its economies can also lend towards improving supply chains to bring down logistics costs. At the same time, the Russia-Ukraine conflict shows no real sign of slowing.
If the two nations reach an agreement in 2023, it could help spark further fuel and commodity prices decline. Both of these events are bullish catalysts for the SPY in 2023.
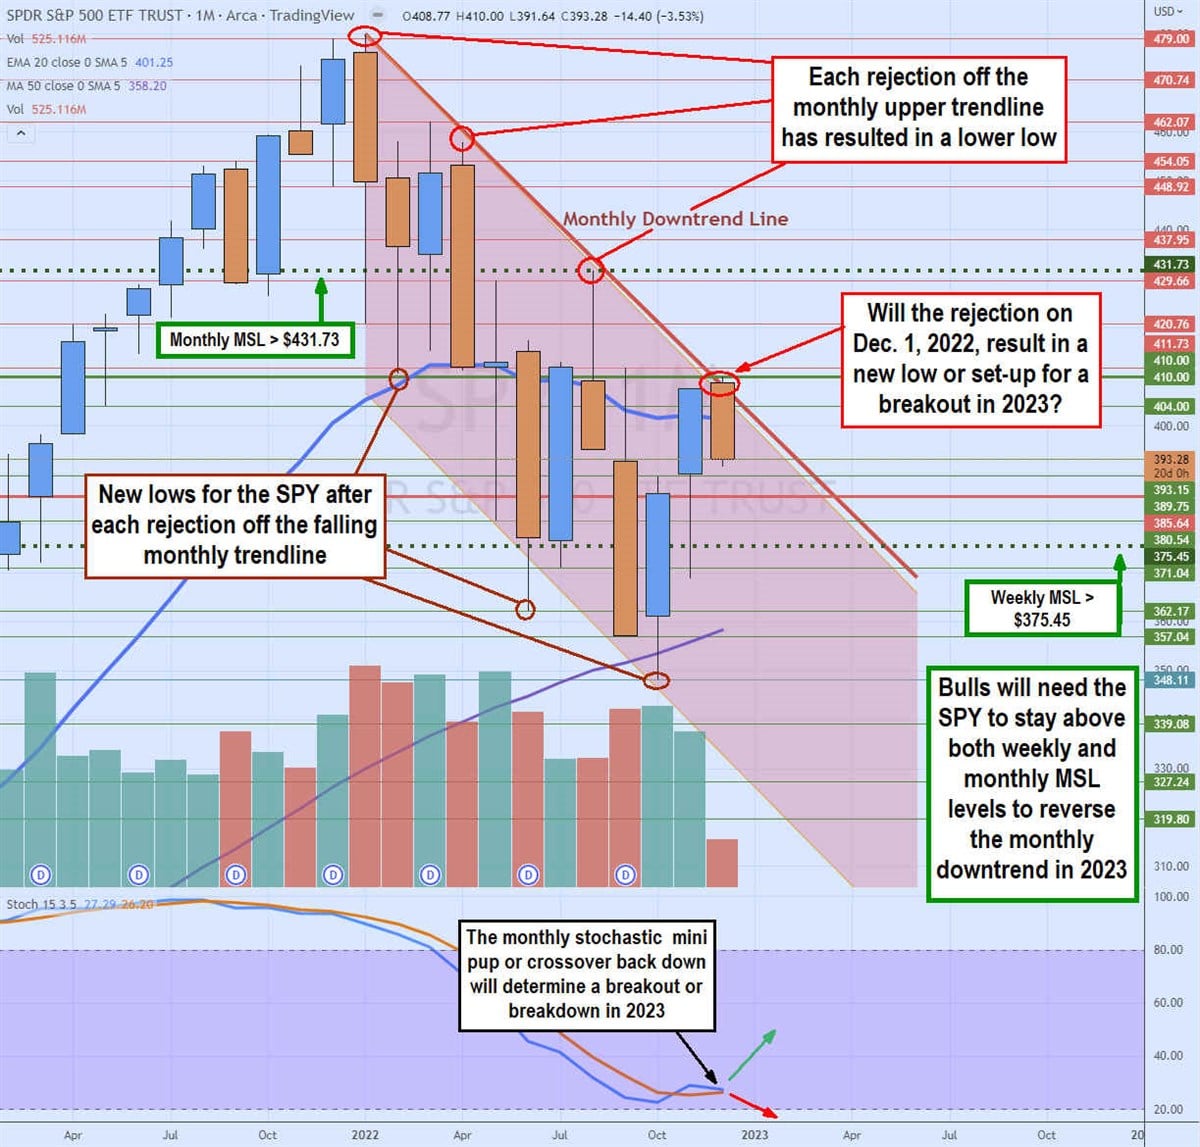
Monthly Downtrend Channel
The SPY has been in a monthly downtrend channel since its peak of $479.98 on Jan. 4, 2022. Each bounce was to a lower high before peaking to a lower low. By drawing parallel lines connecting the highs, you can see a definitive monthly downtrend line. This line has been tested and rejected four times this year.
Each rejection with the exception of December 2022, has resulted in a lower low point before bouncing again to retest a lower high. This is the very definition of a downtrend comprised of lower higher and lower lows. The monthly stochastic completed its full oscillation down from the 90-band in January 2022 to bottom out for a crossover back up off the 20-band in October 2022. The monthly downtrend line was tested again at $410.00 on Dec. 1, 2022.
However, the SPY again rejected the breakout attempt as it fell back under the monthly 50-period moving average (MA) at $401.25. The question arises as to whether this rejection sets up another move to a lower low near the $339 lower trendline level, or a shallow pullback that will once again attempt to breakout through the downtrend line in 2023.
The downtrend line is just below $410.00, but a true monthly market structure low (MSL) trigger would require a breakout up through the $431.73 level. The monthly stochastic bounce has stalled around the 30-band waiting to either slope back up on a mini pup attempt to form a pup breakout above the $410.00 level or cross back down falling through the 20-band and breaking under the monthly 20-period MA at $358.20.
The current Bollinger Bands upper and lower envelope range is compressed at $410.00 and $385.64, respectively. A compression precedes the expansion as prices extend again either lower or higher. The weekly MSL trigger support sits at $375.45, while the monthly MSL trigger sits at $431.73. Bulls need both levels to hold and break out higher to finally break the downtrend in 2023.


