 Sporting goods and outdoor recreational retailer Academy Sports and Outdoors (NYSE: ASO) stock has been resilient as it narrows its losses to (-14%) on the year. As the name implies, the Company sells outdoor recreational products from camping gear, patio furniture and fishing rods to team sports products, and equipment to athletic lifestyle apparel primarily in the southern and southeast U.S. The Company sells national brands and 19 high-quality private label products with the highest store productivity in its peer group. The Company has undergone a transformation in the past four years as it emerged from the pandemic a stronger and more efficient operation. Academy has improved across all elements of the business despite market headwinds including inflationary pressures, supply chain disruption, and rising logistics costs. The Company revised its fiscal 2023 guidance. The regional chain has plans to open eight more stores this fiscal year and accelerate that to 80 to 100 total new stores over the next five years. Prudent investors looking for exposure in the sports and outdoors market recovery can watch for opportunistic pullbacks in shares of Academy Sports and Outdoors.
Q1 Fiscal 2023 Earnings Release
On June 7, 2022, Academy released its fiscal first-quarter 2023 results for the quarter ending April 2022. The Company reported an earnings-per-share (EPS) profit of $1.73 versus $1.41 consensus analyst estimates beating estimates by $0.32. Revenues fell (-7.1%) year-over-year (YoY) to $1.47 billion beating analyst estimates for $1.45 billion. Comparable sales fell (-7.5%). Gross margins were 35.5%. The Company ended the quarter with $472.4 million in cash with no borrowings under $1 billion credit facility. Academy CEO Ken Hicks commented, "We are satisfied with our first-quarter results as the Company continued to position itself for long-term growth and expansion as we executed effectively in a highly dynamic environment and against a very strong prior year quarter.”
Revised Guidance
Academy issued fiscal full-year 2023 EPS of $6.55 to $7.25 versus $6.93 consensus analyst estimates, up from $6.70 to $7.25. Fiscal full-year 2023 revenues are expected to come in between $6.43 billion to $6.63 billion versus $6.66 billion estimates. Comparable sales are expected to fall between (-6%) to (-3%).
Conference Call Takeaways
CEO Hicks detailed the first new store opening on April 24, 2022, since 2019, bringing the total store count to 260 stores in 16 states. He plans to open 80 to 100 new stores in the next five years. The regional chain looks to open stores in Virginia and West Virginia later in the year. They plan to expand beyond the 16 states that have stores. Academy is transitioning out of the pandemic environment and navigating macroeconomic headwinds led by CEO Hicks, who was a former CEO of Footlocker from 2009 to 2014. Each new stores costs approximately $3.5 million. Existing stores are profitable generating $3.91 million in EBITDA in 2021. He noted that the pandemic has influenced consumer trends that support a more active lifestyle supporting sports and recreation. E-commerce grew 19% as the Company continues to invest in the omnichannel experience for its customers.
While all four of its major merchandise division including sports and recreation, outdoors, apparel and footwear saw a decline in sales, they were still above 20% of 2019 levels. The outdoors division sales were over 50% above 2019 levels. The (-7.5%) YoY sales drop illustrations the natural reversion from the height of stimulus spending levels. CEO Hicks is confident in positive sports and outdoors market trends despite the rising macroeconomic challenges which prompted the Company to revise its guidance.
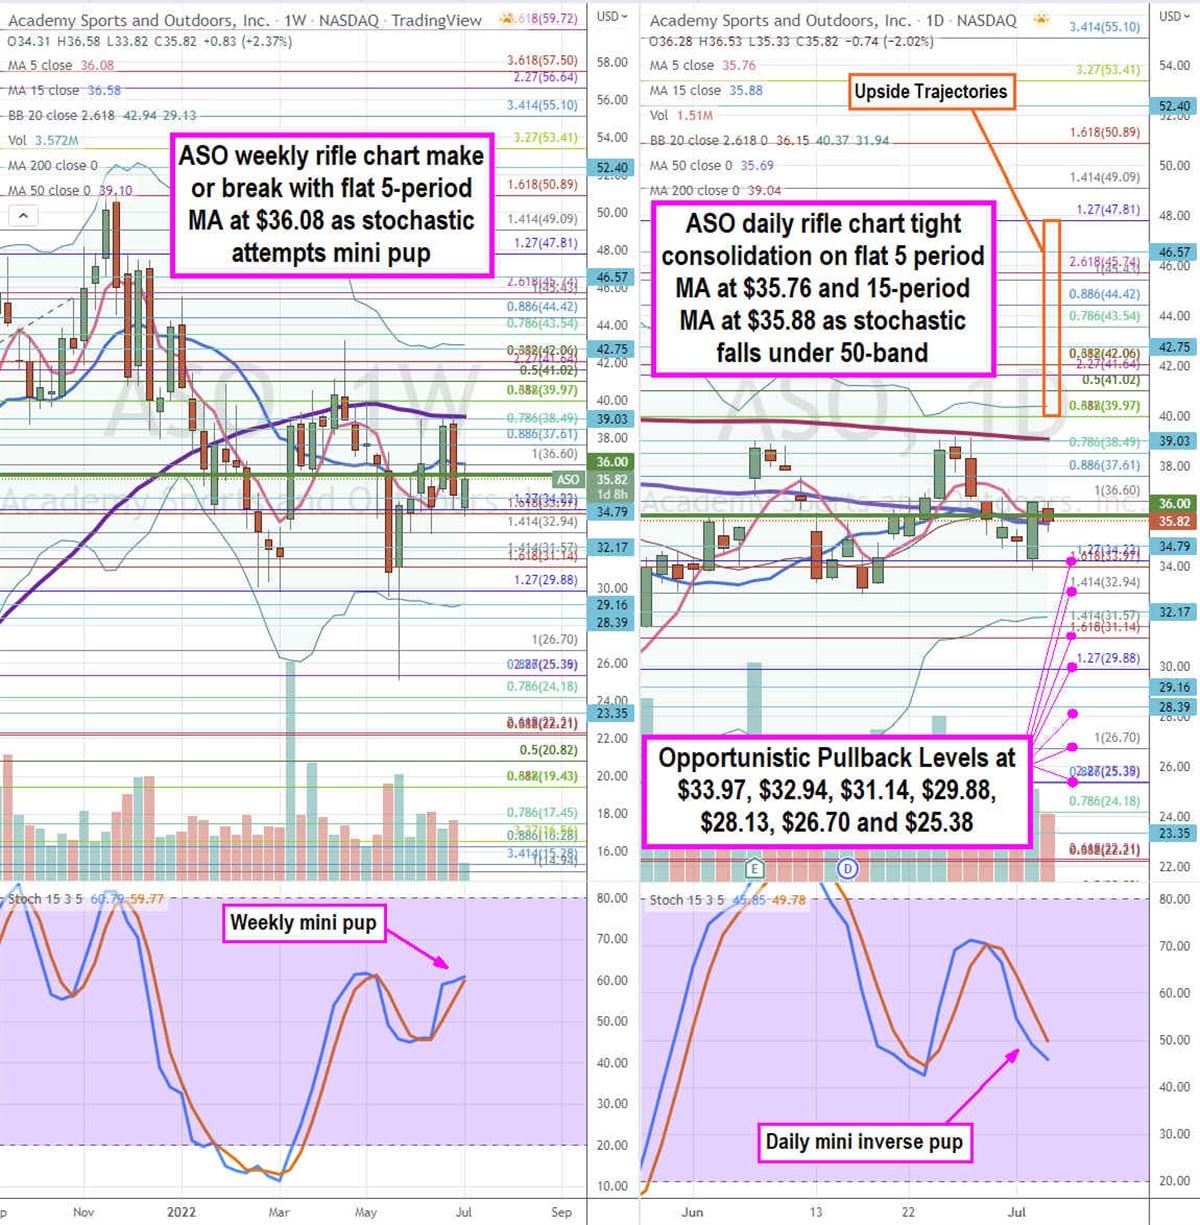
ASO Opportunistic Pullback Levels
Using the rifle charts on the weekly and daily time frames provides a precise view of the landscape for ASO stock. The weekly rifle chart has a make or break after peaking three times off the $38.49 Fibonacci (fib) level. The weekly 5-period moving average (MA) is flat at $36.08 along with the 15-period MA at $36.58. The weekly 50-period MA overlaps with the $38.49 fib resistance. The weekly lower Bollinger Bands (BBs) sit at $29.13 as the stochastic attempts to form a mini pup. The weekly market structure low (MSL) buy triggers on a breakout through $35.82. The daily rifle chart is in a make or break with flat 5-period MA at $35.76, 15-period MA at $35.88, and the 50-period MA at $36.59. with daily lower BBs at $31.94 and upper BBs at $40.37. The daily stochastic is falling under the 50-band. The daily 200-period MA sits at $39.04. Prudent investors can look for opportunistic pullback levels at the $33.97 fib, $32.94 fib, $31.14 fib, $29.88 fib, $28.13, $26.70 fib, and the $25.78 fib level. Upside trajectories range from the $39.97 fib up towards the $47.81 fib level. Competitors and peers include Big Five Sports (NASDAQ: BGFV) and Hibbett Sports (NASDAQ: HIBB).