 Healthcare ecosystem management platform developer Phreesia (NYSE: PHR) stock is sunk (-40%) on the year. The Company caters to small to medium sized physician offices with a cloud-based software as a service (SaaS) platform that optimizes workflow and operation efficiency. It’s automated tools seamlessly handle everything from registration, appointment scheduling, and patient surveys to medical billing, automated data integration and reporting analytics. Their healthcare management platform serves over 100 million patient visits a year impacting the entire healthcare ecosystem. Healthcare is one of the few recession proof sectors that investors may consider sheltering in place. The Company has raised its adjusted EBITDA outlook which improves its timeline for profitability. Phreesia was rated #1 in Patient Intake Management by KLAS for four consecutive years from 2019 to 2022. The Company is seeing benefits from going live with its new ERP system which is accelerating operating leverage across all investments. Phreesia is targeting $500 million in annualized revenues in fiscal 2025. Prudent investors seeking a healthcare infrastructure IT play still experiencing double digit growth can watch for opportunistic pullbacks in shares of Phreesia.
Q1 Fiscal 2022 Earnings Release
On May 17, 2022, Phreesia released its fiscal first-quarter 2022 results for the quarter ending April 2022. The Company reported an adjusted earnings-per-share (EPS) loss of (-$0.99) excluding non-recurring items versus consensus analyst estimates for a loss of (-$1.09), beating estimates by $0.10. Revenues rose 31.2% year-over-year (YOY) to $63.35 million, beating analyst estimates for $62.24 million. Phreesia CEO Chaim Indig commented, “We started the year strong with gains in new clients and expansion within existing clients across healthcare services and life sciences and began to generate operating leverage from our accelerated investments in fiscal years 2021 and 2022.”
Reaffirmed Guidance
Phreesia reaffirmed fiscal 2023 revenues between $271 million to $275 million versus $273.62 consensus analyst estimates. The Company expects annualized revenue target of $500 million during a quarter in fiscal 2025.
Conference Call Takeaways
Senior Vice President Balaji Gandhi reviewed some highlights for the quarter. Investments continue to drive strong growth of 33% in the first quarter. Payment processing revenues were slightly below expectations and could persist for the remainder of the year, which prompted the Company to maintain its original revenue guidance of 27% to 29% growth. Life sciences was robust with 51% YoY growth during its seasonally strong period. During the quarter, the Company began to see strong operating leverage across all investments prompting the Company to lift adjust EBITDA outlook to a range of (-$126 million) to (-$122 million), which is an improvement from its original (-$154 million) to (-$149 million) outlook. CEO Indig reflected on the 17 year history of the Company and praised his teams and is happy to be meeting in person again. The Company brings in approximately $11,500 subscription revenue per client consistently for several quarters. The average revenue per healthcare services client was $19,193 in fiscal Q1 2023, down (-5%) YoY. However, the average number of healthcare service clients rose 33% to 2,526. The Company ended the quarter with $269.2 million.
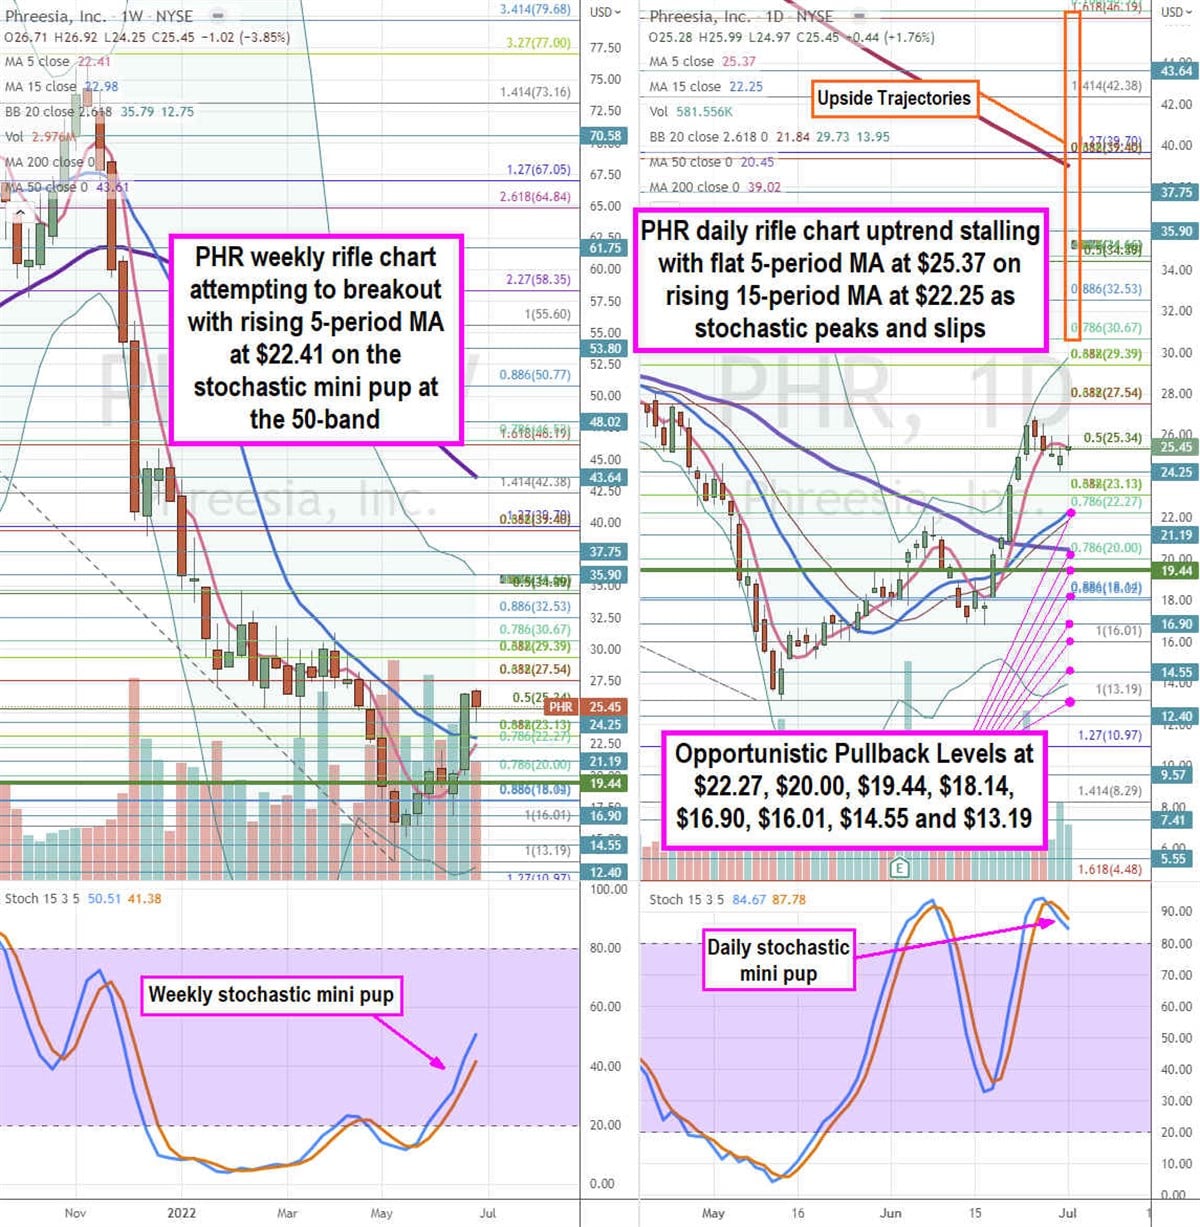
PHR Opportunistic Pullback Levels
Using the rifle charts on the weekly and daily time frames provides a precision view of the landscape for PHR stock. The weekly rifle chart formed an inverse pup breakdown formed on the collapse through the $27.54 Fibonacci (fib) level falling to $13.19 before staging a rally. The weekly rifle chart bounced on the market structure low (MSL) buy trigger breakout above the $19.44 level. The weekly 5-period moving average (MA) is rising at $22.41 to attempt a crossover through the 15-period MA at $22.98 as the weekly stochastic mini pup rises through the 50-band. The weekly upper Bollinger Bands (BBs) sit at $35.79. The daily rifle chart uptrend stalled with a flat 5-period MA at $25.37 and rising 15-period MA at $22.25. The daily 50-period MA sits at $20.45 with 200-period MA at $39.02. The daily upper BBs sit at $29.73. The daily stochastic peaked and crossed back down towards the 80-band. Prudent investors can watch for opportunistic pullback levels at the $22.27 fib, $20.00 fib, $19.44 daily MSL trigger, $18.14 fib, $16.90, $16.01 fib, $14.55, and the $13.19 fib level. Upside trajectories range from the $30.67 fib level up towards the $46.52 fib level.


