 Digital advertising technology (AdTech) company The Trade Desk (NYSE: TTD) stock took a nosedive when digital advertising networks signaled the slowdown in digital advertising. It’s been a rough two-years for the adtech industry. Apple’s (NASDAQ: AAPL) privacy clampdown and Google’s (NASDAQ: GOOGL) blocking of third-party tracking cookies on its Chrome browser were two major blows to adtech companies that directly impacted major players like Facebook (NYSE: FB), Twitter (NYSE: TWTR) and Pinterest (NASDAQ: PINS). In fact, Apple’s App Tracking Transparency (APP) features are estimated to impact Facebook’s revenues by $12.8 billion in 2022. Couple that with the headwinds of inflation, cooling consumer spending, collapsing share prices, and a recession could lead investors into thinking that adtech is dead. It is worth noting that Google has opted to delay that until the second half of 2024. In particular, Snap (NASDAQ: SNAP) earnings laid the final blow for adtech companies like The Trade Desk and competitor Magnite (NASDAQ: MGNI) as industry sentiment fell into the toilet. However, connected TV (CTV) and streaming content is a secular growth engine that can power The Trade Desk programmatic TV (PTV) services to new heights. CEO Jeff Green has predicted that every streaming service will have ad-supported versions of their streaming platform by the second half of 2023.
What is Connected TV (CTV)?
Connected TV refers to any device built to support multimedia and connect streaming through the internet. These include smart televisions, game consoles, and streaming hardware devices including Roku Streaming Sticks (NASDAQ: ROKU) , Google Chromecast, Apple TV, Amazon Fire (NASDAQ: AMZN), Microsoft XBOX (NASDAQ: MSFT), and Sony PlayStation (NYSE: SNE). CTV enables programmatic advertising.
What is Programmatic TV (PTV)?
This is the type of digital advertising that targets audiences more specific and to the product utilizing algorithmic ad purchasing software through a programmatic TV platform. PTV enables advertising individualism enabling a brand deliver specific commercial to a specific type of viewer or household. Rather than the conventional way of running a general commercial during a specific TV program for all audiences, PTV enables advertisers to be more precise with their advertising spend. It enables different commercials to be shown to different audiences during the same streaming broadcast. The algorithms target ads to better match views based on their demographics, income, preferences, age, and etc.
Smooth Operator
The Trade Desk reported its Q2 2022 earnings earnings-per-share (EPS) profits of $0.20 to match analyst estimates for $0.20. However, revenues rose 34.6% year-over-year (YoY) to $376.96 million to beat analyst estimates for $365.2 million. CEO Green commented, “We delivered outstanding performance in the second quarter, growing 35% versus a year ago, significantly outpacing worldwide programmatic advertising growth. More of the world’s leading brands are signing major new or expanded long-term agreements with The Trade Desk, which speaks to the innovation and value that our platform provides compared to the limitations of walled gardens.”
Good Times Ahead
The Trade Desk raised its guidance for Q3 2022 revenues to come in at least $385 million beating $382.3 million consensus analyst estimates. The Company raised adjust EBITDA to $140 million. The recent announcement that streaming giants Netflix (NASDAQ: NFLX) and Disney+ (NYSE: DIS) will launch lower priced ad-support streaming memberships is a big boon for the Trade Desk and the adtech industry. Disney already announced a landmark expanded deal with The Trade Desk on July 22, 2022, to power greater audience activation at scale programmability.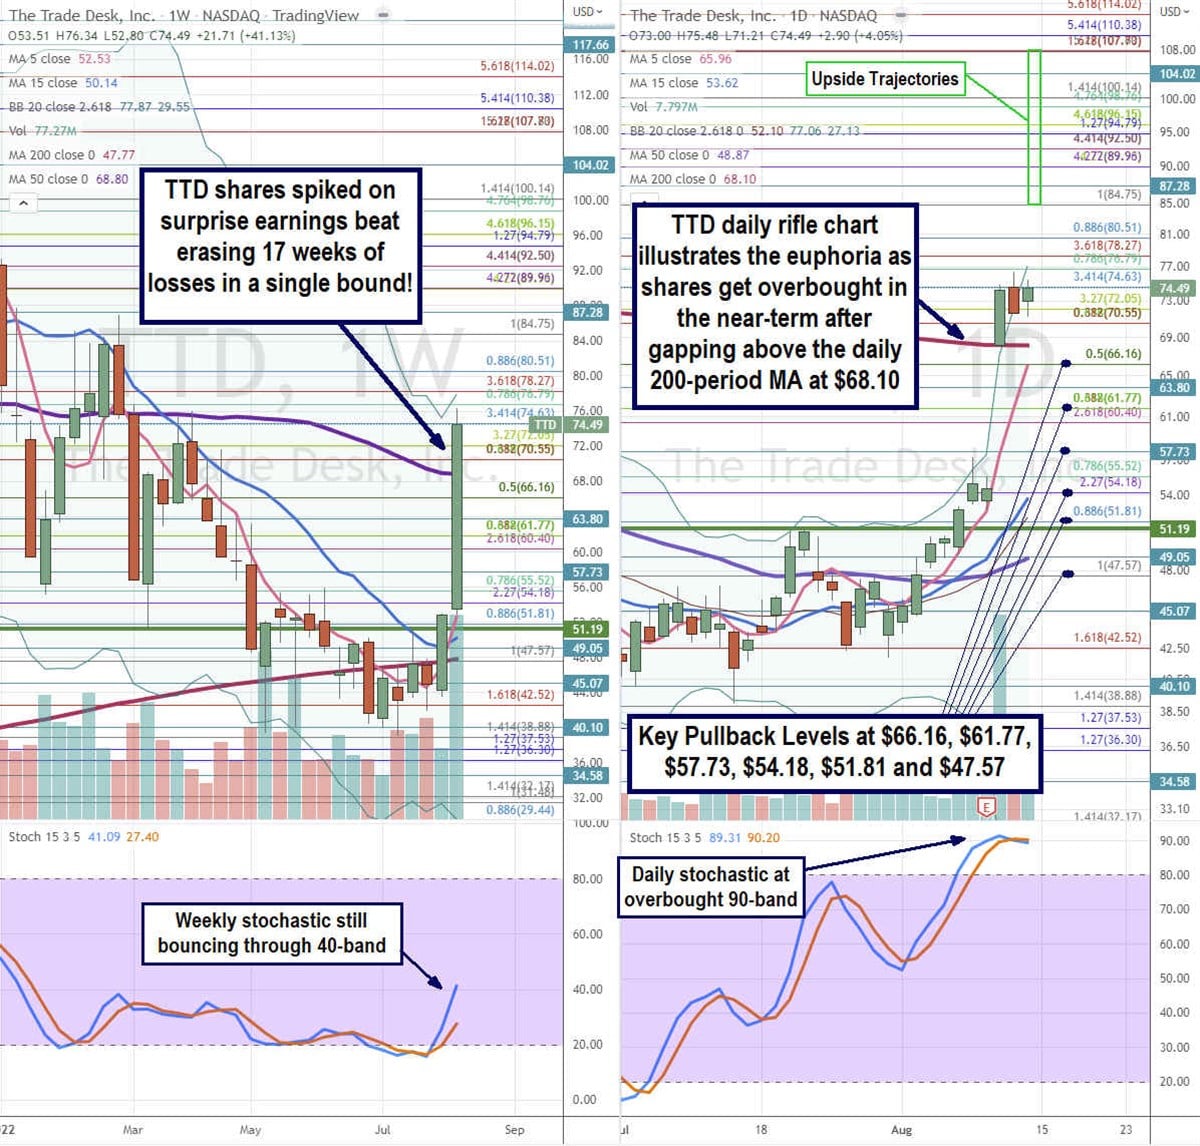
What the Charts Say
Using the rifle charts on the weekly and daily time frames provides a precision near-term view of the playing field for TTD shares. The weekly rifle chart formed an inverse pup breakdown on the rejection of the $70.55 Fibonacci (fib) level causing shares to cascade lower until bottoming out near the $38.88 fib. The weekly downtrend managed to reverse and breakout after triggering the weekly market structure low (MSL) buy signal above $51.19. The weekly 5-period moving average (MA) support is still trying to catch up at $52.53 followed by the 15-period MA support at $50.14. Shares spiked right through the weekly 50-period MA at $68.80 on earnings. Shares almost reached the weekly upper Bollinger Bands (BBs) sit at $77.87 in a single candle. The daily rifle chart uptrend has a rising 5-period MA support at $65.96 followed by the 15-period MA rising at $53.62. The daily 200-period MA held the gap at $68.10. The daily upper BBs sit at $77.06 as the stochastic is extremely overbought at the 90-band. Investors looking to get in on TTD should not chase but wait for key pullback levels at the $66.18 fib, $61.77 fib, $57.73, $54.18 fib, $51.81 fib, and the $47.57 fib level. Upside targets range from the $84.75 fib level up towards the $107.80 fib level.