
Solar energy solutions provider First Solar Inc. (NASDAQ: FSLR) stock had an impressive 69% gain in 2022. Shares more than doubled from their July 2022 low of $60.96 to close the year at $149.79. Negative news, downgrades and negative blogs haven’t been able to stop First Solar shares from surging.
Investors wonder if shares have gotten too far ahead of themselves as the Company is still losing even more money than a year ago. Will 2023 be a profit-taking year for the stock? It seems that solar energy is the one segment of clean energy that has outperformed the market, unlike electric vehicle (EV) stocks which have collapsed, led by EV leader Tesla Inc. (NASDAQ: TSLA), which saw its shares collapse nearly (-40%) in December alone to close out the year down (-69%).
First Solar is the Anomaly
Smaller EV players got demolished, including Rivian Automotive Inc. (NASDAQ: RIVN) shares down (-82%), Fisker Inc. (NYSE: FSR) down (-56%), and Lucid Group Inc. (NASDAQ: LCID) down (-83%) for 2022.
However, First Solar shares have even outperformed the whole solar segment beating out SolarEdge Technologies Inc. (NASDAQ: SEDG) stock, up only 0.29%, Sunrun Inc. (NASDAQ: RUN) down (-32%), SunPower Corporation (NASDAQ: SPWR) down (-16%), and the Invesco Solar Portfolio ETF (NYSEARCA: TAN) down (-7%).
The innovator of thin film photovoltaic (PV) solar module maker has many investors scratching their heads as to why it’s run up so hard with only a 4% short interest and whether shares can hold its gains or if the sell-off may be just as dramatic as the rise.
Where’s the Beef?
First Solar reported its fiscal Q3 2022 results for the quarter ending in September 2022 on Oct. 27, 2022. The Company reported an earnings per share (EPS) loss of (-$0.46) excluding non-recurring items, missing consensus analyst estimates for a loss of (-$0.24), by (-$0.22). Operating losses were (-$68 million) compared to an operating profit of $145 million in the year-ago period.
However, the operating income drop was largely due to the gain from selling its Japan project development platform and higher logistics costs. Revenues rose 7.8% year-over-year (YoY) to $629 million, missing analyst estimates of $748 million.
Mixed Guidance
First Solar lowered its fiscal full-year fiscal 2022 EPS guidance between (-$0.65) to (-$0.35) from (-$0.25). The Company narrowed its expected revenues to $2.6 billion to $2.7 billion versus $2.61 billion consensus analyst estimates.
Analyst Downgrades
The analysts have been skeptical, as indicated by their actions. On Nov. 28, 2022, JP Morgan downgraded shares of First Solar to Neutral from Overweight and dropped its price target to $140 from $190. Analyst Mark Strouse commented, "With the stock up more than 120% over the past four months, we believe the 'easy money' has now been made."
On Dec. 6, 2022, GLJ Research cut its rating to a Sell on First Solar shares with a $46.80 price target. Its analyst Gordon Johnson said its recent quarter was a disaster, with gross margins dropping to 3.3%, falling way short of 9.1% analyst estimates.
He points out that free cash flow has been negative for the past year despite the best solar module pricing climate since 2011. He expects poly-Si prices to collapse in 2023 from the record supply surge in Q4 2022.
Negative News and Events
On Dec. 15, 2022, California regulators approved a plan to lower payments to households that install new rooftop solar panels and sell excess electricity back on the grid.
This affects new installs, not existing installs. While solar companies say the tax credits and payments are a key incentive to expand the adoption of solar energy, the utilities argue that the rooftop solar program unfairly taxes non-solar users as subsidy costs are passed onto its customers that don’t have solar panels, which are often lower-income households. On Dec. 30, 2022, Nikkei reported that U.S. solar installations fell (-23%) in 2022.
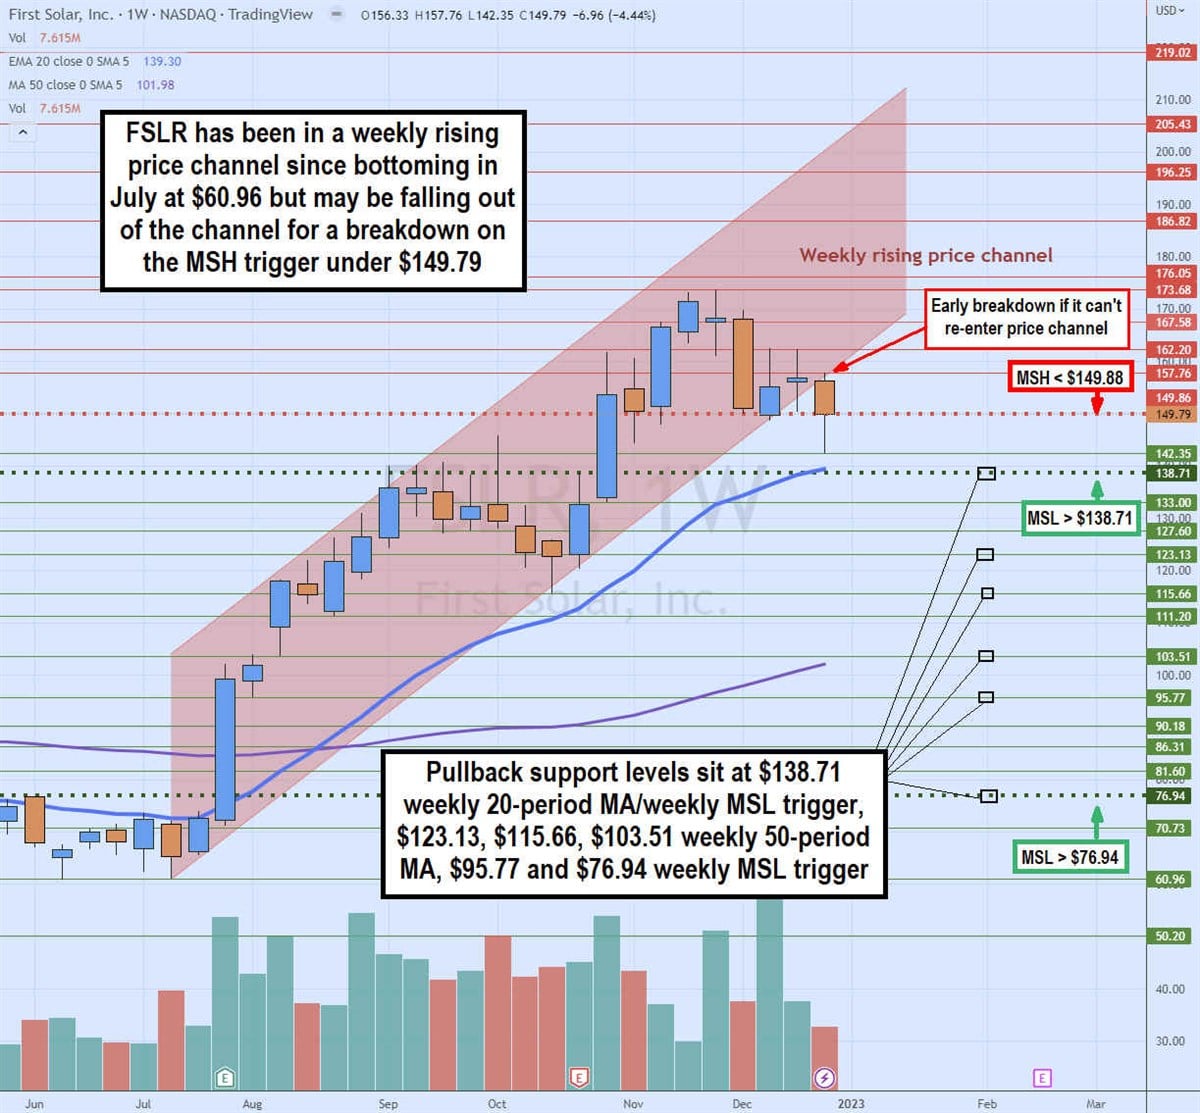
Weekly Rising Channel Early Breakdown
FSLR stock has been in a weekly rising channel since its low of $60.91 in July 2022 and bounced up through the weekly market structure low (MSL) buy trigger above $76.94. Shares continued to make higher highs on bounces, followed by higher lows on pullbacks.
The weekly 20-period exponential moving average (EMA) breakout was triggered in August as it crossed through its weekly 50-period MA. A second weekly MSL buys trigger formed above $138.71 in November. The weekly 20-period EMA and the weekly 50-period MA have yet to test but remain supported at $139.30 and $101.98, respectively.
The weekly market structure high (MSH) sell trigger formed on a breakdown under $149.86. Shares briefly fell under that level and out of the rising price channel in December but managed to bounce back to the MSH trigger level. It has yet to return above the lower trend line of the rising price channel.
This could signify a breakdown finally forming under the price channel. The uptrend would remain intact until the weekly 20-period MA breaks, overlapping the $138.71 weekly MSL trigger. Pullback supports on this one must be very deep to avoid a falling knife when the momentum reverses back down. They sit at $138.71 weekly 20-period EMA and MSL trigger, $123.13, $115.66, $103.51 weekly 50-period MA and MSL trigger, $95.77, and $76.94.


