Oilfield services stocks like Halliburton (NYSE: HAL) and Schlumberger (NYSE: SLB) are pulling back following their Q3 earnings reports, but this is not the time to sell. These stocks are supported by a global supercycle that has years to run. The cause for the post-release weaknesses is tepid results, but only compared to the analysts' estimates. The takeaway is that near-term strengths were priced into the market, and Q4 estimates are getting reset.
This has the bar lowered for these stocks, setting them up for another rally later in the year.
"We believe the market fundamentals remain very compelling for our business," Schlumberger CEO Olivier Le Peuch said. "The oil and gas industry continues to benefit from a multiyear growth cycle that has shifted to the international and offshore markets where we are the clear leader."
Oilfield Services Results: Nothing But Bullish for Investors
The results from SLB and HAL left a little to be desired in that they failed to outpace the Marketbeat.com consensus estimates, but those estimates had been rising for many quarters. The takeaways investors should be focusing on is the fact that growth remains solid in the low-double-digits for revenue, and margins are improving. Strength is centered in all regions and segments, although there was a noticeable shift toward international markets during the quarter.
While SLB and HAL missed the top line, the underperformance was marginal at best and offset by strength on the bottom line. Both SLB and HAl outperformed their consensus estimates, growing earnings sequentially and YOY.
"Everything I see today strengthens my conviction in the long duration of this upcycle. Against this backdrop, we expect continued demand growth for oilfield services in 2024 and beyond,” said Halliburton CEO Jeff Miller.
As robust as the growth outlook is, it is the cash flow and FCF that will help sustain the uptrend in oilfield stocks. Not only are earnings and margins widening, but FCF is improving, allowing for share repurchases, dividends, and debt reductions.
Cash balances on balance sheets are up significantly compared to last year, suggesting that aggressive dividend increases may also be forthcoming. Baker Hughes pays the highest yield currently, having not cut the payment during the pandemic. However, Schlumberger and Halliburton both cut theirs and have substantial room to grow. To match the pre-pandemic payouts, Schlumberger investors might see the distribution grow by 100% from its current levels and Halliburton by 12%.
Regarding repurchases, Schlumberger spent $0.151 of its $1.04 billion in FCF to repurchase shares, while Halliburton repurchased $200 million worth of shares. Based on the outlook for revenue and earnings, repurchases should continue at a steady pace for the foreseeable future.
Baker Hughes Set to Report: Analyst Lift Targets for Oilfield Stocks
Baker Hughes (NYSE: BKR) is set to report earnings before the end of the month and can be expected to post similar results. The difference is that analysts have had time to reset their expectations for Q3 and may have lowered the bar enough for the company to produce relative strength.
Regardless, Baker Hughes is expected to sustain growth in the 20% range with margin improvement. In this scenario, the analysts should continue lifting their price targets for BKR stock as they did following reports from SLB and HAl. All 3 are rated Moderate Buy/Buy with price targets that are trending higher in 2023 and imply modest to moderate double-digit gains.
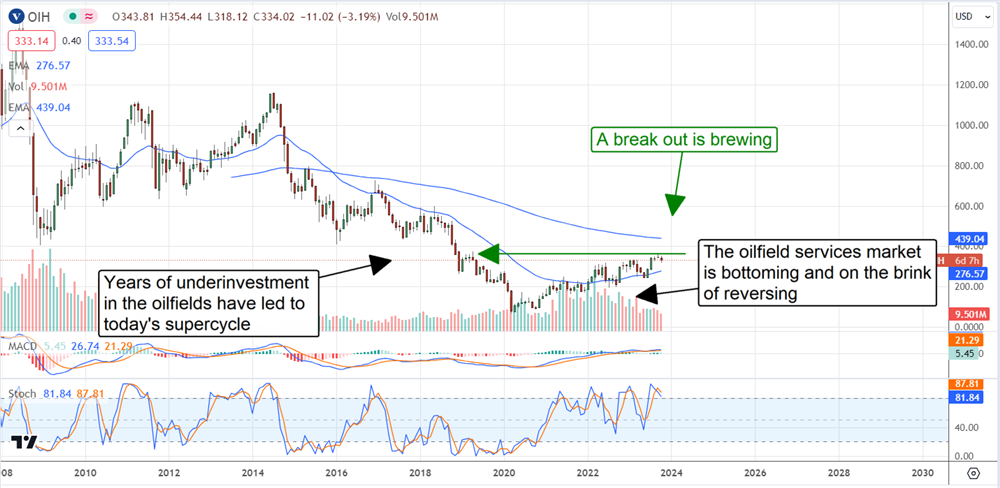
The Technical Outlook: Oilfeid Services Trending Higher
The VanEck Oilfield Services ETF (NYSEARCA: OIH), whose top 3 holdings are SLB, HAL and BKR for 40% of the portfolio, is trending higher. The ETF is pulling back currently but in alignment with the trend and still above critical support. Critical support is near the long-term moving average, near $320, and should produce a solid bounce when reached. If not, this market could correct to lower levels where it would present deeper value and better yield before continuing to trend higher. In the long term, this market appears to be reversing and is on track to gain triple digits over the next few years.