The S&P 500 (NYSEARCA: SPY) is expected to post earnings growth for Q4 2023, but that is about the best that can be said. The consensus is for growth, but the bottom has fallen out of the outlook and can be expected to worsen before it gets better.
Data from the National Retail Federation shows consumer spending weakening, foreshadowing a poor holiday spending season and lackluster results for retailers. Meanwhile, the beaten-down Utility Sector (NYSEARCA: XLU) has a robust and brightening outlook, suggesting it’s the place to park money for the next few quarters. Then we wait and see what happens with the consumer, inflation, the Fed, and the economy.
The consensus for earnings growth retreats
The Q3 reporting season unfolded exactly as expected, with broad S&P 500 growth tracking in the low-single-digit range and the consensus estimate for Q4 moving lower. The difference between this cycle and the previous is that the pace of retreat in the Q4 estimate is accelerating and may continue to do so, given the trend and conditions.
The consensus estimate for the S&P 500 reported by Factset is down to 4.1% from the high near 8.4% set at the start of the season and may turn negative before the cycle begins. Retail earnings are due out soon and will impact the figures.
On a sector basis, only 3 of the 11 S&P 500 sectors are seeing upward revision to their outlook. Those include the Information Technology (NYSEARCA: XLK), Energy (NYSEARCA: XLE), and Utility Sectors, and each has a catalyst to drive their shares higher. The Energy Sector is driven by cash flow, balance sheet improvement, dividends, and share repurchases, while Info Tech AI. The Information Tech sector will grow earnings in Q4; Energy Sector earnings will decline on the deleverage of oil prices.
The Utility Sector, which is in a regulation-supported growth cycle, is expected to post the 2nd-strongest earnings growth for the quarter at just over 32%. It is also seeing the most aggressive revisions, including for 2024. Regarding the outlook for 2024 earnings growth, the S&P 500 is expected to grow, but the estimates are falling for 9 of the 11 sectors, not including utilities.
Uncertainty reigns supreme for 2024
The outlook for 2024 assumes that earnings growth will continue and accelerate in 2024, but the outlook is cloudy. Geopolitical tensions, persistent inflation, interest rates, and a still-hawkish FOMC have the economy on track to contract. Even if recession never materializes, volatility is expected, and there are signs of reversal in the VIX.
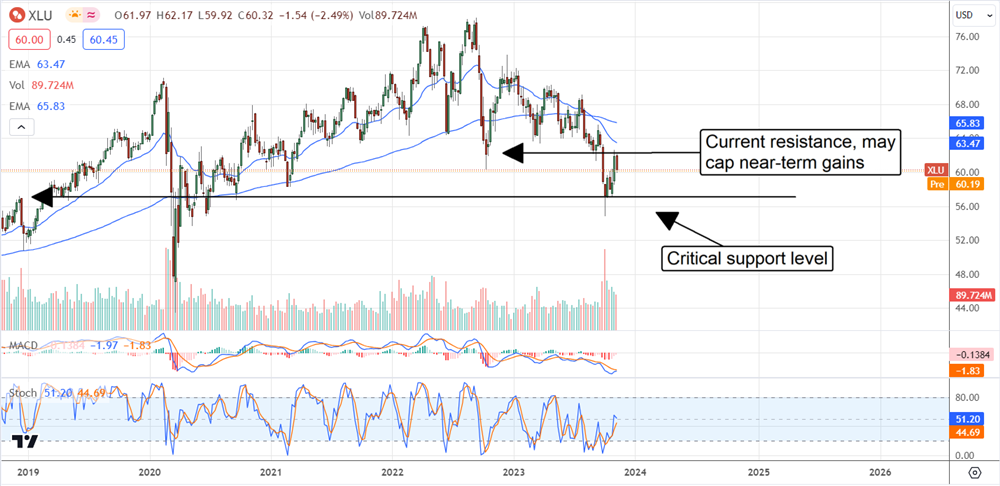
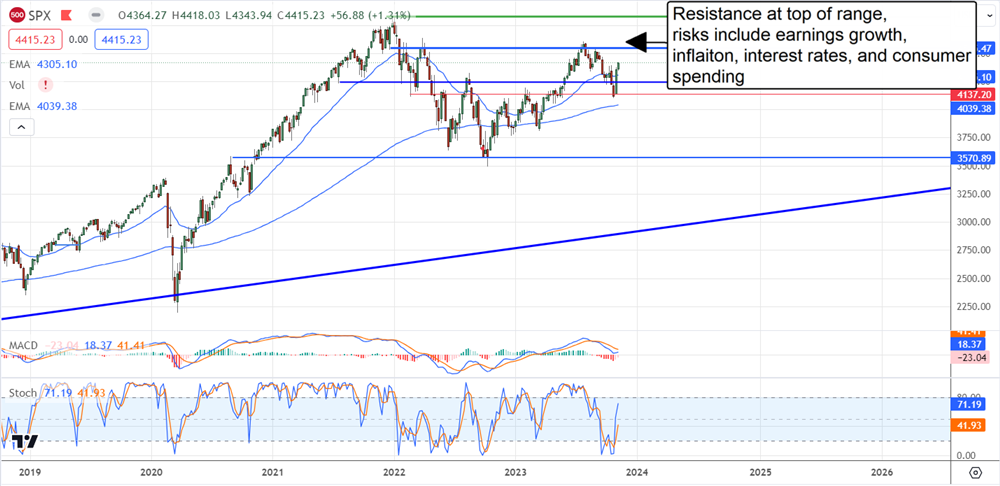
Utility stocks, already trading near a significant low, trade with a much lower beta than the S&P 500 and can reduce portfolio risk while paying significantly high yields. The S&P 500, however, is high in its trading range, with risk skewed to the downside.
The Utility Sector ETF (XLU) pays a solid 3.5% with a beta near 0.6, and there are much better yields in the group. The ETF’s top holding is NextEra Energy (NYSE: NEE), with a yield of 3.4%. It doesn’t beat the sector average but provides ample exposure to green power and decarbonization, while the #2 and #3 holdings, the Southern Company (NYSE: SO) and Duke Energy Corporation (NYSE: DUK), pay more than 4%. All of these stocks have a history of distribution increases.
The technical outlook: utility stocks rebound from critical support
Utility stocks are down 15% YTD compared to a 15% gain in the S&P 500. However, while the S&P 500 shows signs of resistance near the top of its trading range, the XLU shows the opposite, with signs of support near the bottom. This support level coincides with highs set in 2018 and the 2020 lows, so it is a significant target for bulls and bears. Assuming the market continues to hold at this line, this ETF should consolidate at the current levels, if not begin to rally as Q4 reporting approaches. The critical resistance is near recent highs, about $62.50.