
It’s not only a good rule of thumb to avoid trading on technical signals before they are completed but a necessity that is as true for Zscaler (NASDAQ: ZS) as for any publicly traded stock. However, that does not mean you can’t prepare for a trade when you see one developing, which is what is happening with Zscaler. As sloppy as it is, as long as it has taken to unfold, Zscaler is amid a reversal that will likely take the stock much higher than it trades today.
The caveat is that the pattern, a large and drawn-out Head & Shoulders, is still in its last innings and may take another quarter or two, possibly more, to deliver on its promise. Between then and now, interested investors should keep up with the price action, hold some capital in reserve and prepare to build (or build on) positions when the timing is right.
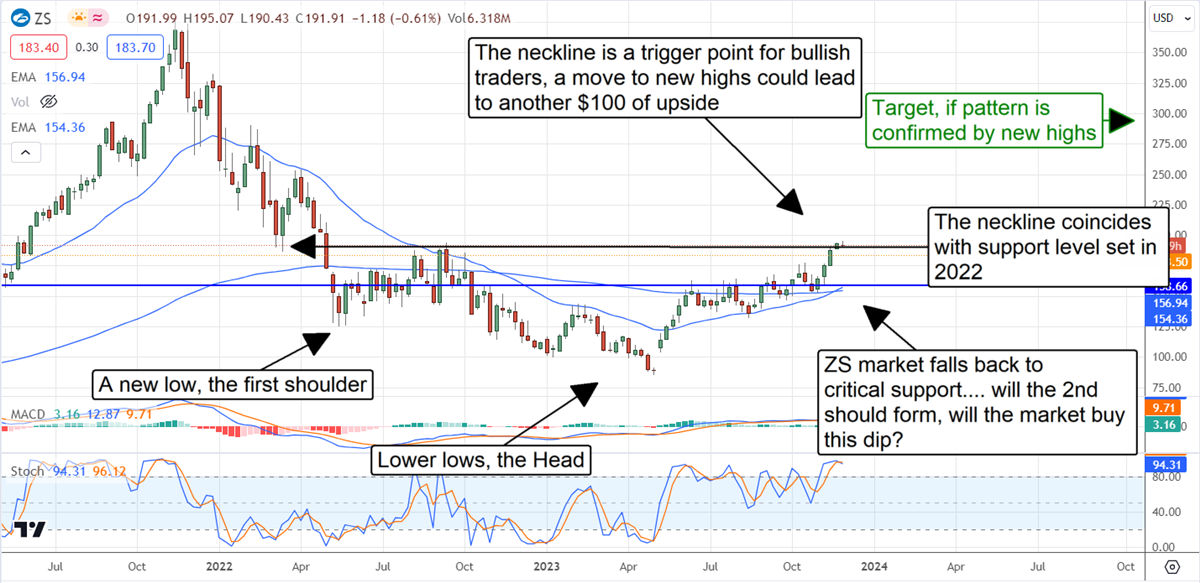
What is a Head & Shoulders pattern? In this case, the bullish Head & Shoulders pattern signals a market bottom and a high potential for reversal. The pattern is formed when the market hits a new low, rebounds and then corrects again to set a lower low. The next rebound should take the market at least above the prior low and potentially up to or above the prior high. Another correction will follow to form the right shoulder of the pattern, which is where Zscaler is today. We want to see another rebound from a level higher than the lowest low and a retest of resistance at the pattern's neckline.
Why did Zscaler pull back? Why might it rebound soon?
The reason why Zscaler shares pulled back from resistance is billings. Billings grew by 34% in FQ1, which is a robust figure but slightly less than the analysts' forecasts. Because billings are used to forecast future growth, it looks like growth is slowing, but there is a caveat.
Checkpoint Software (NASDAQ: CHKP) also reported weaker-than-expected billings but chalked it up to FX translation and the cost of money. Clients using the platform hesitate to commit to long term deals, but current and new business remains strong. The takeaway is that billing weakness is less of a red flag than it could be, and Zscaler’s guidance is likely cautious.
Zscaler might rebound soon because Q1 results were stronger than expected, and the guidance for Q2 and the full year was raised at the top and bottom lines to a level above the consensus forecast. The company reported $496.7 million in net revenue for a gain of 39.7% over last year, beating the consensus by 500 basis points. Because strength was seen in all segments, driven by demand for zero-trust security and AI, the company will scale its go-to-market ability and accelerate the top-line growth.
Earnings were also strong, with the GAAP loss falling more than 50% YOY and adjusted net earnings more than doubled. The adjusted net $106.5 million is an operating margin of 21.5%, resulting in $0.67 in adjusted EPS or $0.18 (about 37%) better than the Marketbeat.com consensus forecast. Regarding guidance, Zscaler execs forecast Q2 and full-year EPS of $0.57 and $2.45 at the range's low end compared to consensus figures of $0.52 and $2.24.
The analysts like what they see in Zscaler's results
Billing weakness or not, the analysts like what they see in Zscaler results. Marketbeat is tracking two boosted price targets in the first 12 hours since the release, from Needham & Company to a level just shy of the highest price target, and others have come out with commentary. Dan Ives and his team at Wedbush are more impressed by the deal momentum than with billings and see this company as a leader in its space and zero-trust architecture in its earliest innings.
Wedbush has a rating of Outperform, aligning with Needham’s Strong Buy, and raise its price target to $210 compared to the consensus of $190. Although the consensus figure assumes fair value, most recent targets have the market in the $200 to $229 range, which puts it at a two-year high and at a level that would confirm a full reversal in the price action.