Gilead Sciences (NASDAQ: GILD) share price tanked following the Q3 release on what was otherwise a good report. The company is gaining traction in key markets, sustaining its core business, and offsetting the expected decline in COVID-19 sales that aren't declining as fast as expected.
The takeaway is that business is growing despite the COVID-19 cliff, and the outlook for 2024 is favorable to share prices. Dominance in the HIV market is expected to continue, sales of key drugs are growing, and the pipeline for new treatments suggests the company can sustain its capital return program. With the shares trading at 12X earnings, the yield near 4%, and guidance on the rise, it's no wonder someone is buying GILD on the post-release dip.
Gilead Sciences has a resilient quarter
Gilead Sciences didn't have a strong quarter, but strength in growth segments was sufficient to offset weakness in the COVID-19 franchise and result in resilient results. The company posted $7.05 billion in net sales for a slim gain of 0.1% over last year. The performance is 370 basis points better than expected, compounded by margin strength and increased guidance.
Segmentally, weakness in Liver Disease and Veklury (COVID-19) was offset by strength in Oncology, HIV, and Other. Liver Disease contracted by 10% while HIV grew by 4% and Oncology by 33%. Regarding products, Veklury sales fell 31% to fall below 10% of sales. Trodelvy's 58% led oncology, while cell therapies grew by 22% and Biktarvy by 12%.
The margin news is mixed, including higher expenses and R&D spending, which helped lower the effective tax rate. The result is $2.29 in adjusted earnings, up $0.39 compared to last year and outpaced the consensus by $0.38.
The resilience is expected to continue, as seen in the full-year guidance raised for GAAP and adjusted results at the top and bottom lines. The company expects adjusted EPS from $6.65 to $6.85, up 20 cents at the low and five cents at the top, compared to the consensus of $6.62.
Cash flow, fundamentals, and capital returns are healthy
Gilead Sciences is a well-capitalized business with a healthy balance sheet and cash flow to sustain capital returns. The company repositioned some debt during the quarter, raising cash to bolster the balance sheet, but ultimately lowered its long-term debt load and increased shareholder equity compared to last year.
Regarding the balance sheet, cash is up $0.4 billion to $8.0 billion, including $2.3 billion in debt repayment, $0.935 billion in dividends, and $0.300 million in share repurchases. At the same time, total long-term leverage remains well below 2X equity.
The dividend is attractive, with shares trading near 12X earnings. The distribution is worth about 3.75% and has a positive growth outlook. The company has increased the payment for 8 consecutive years at a mid-single-digit CAGR and is paying less than 50% of earnings at the low end of the range.
Analysts hold onto Gilead Sciences
This year, the analysts' activity in Gilead Sciences is mixed and light but favorable to buy-and-hold investors. The sentiment fell to a firm Hold from Moderate Buy over the past year, but the price target increased and stabilized with a gain of 12.5%. The consensus is about 17% above the post-release action and may move higher, given the Q3 results.
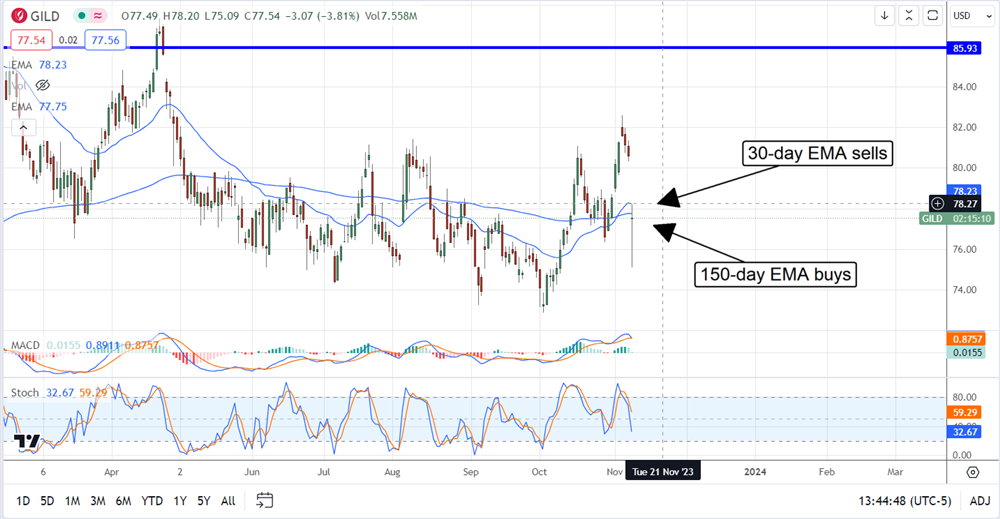
Regardless, a move to the consensus target of $90 would put the stock at a new multi-year high and complete a reversal in this market. In that scenario, the stock price could return to the 2015 highs near $115. As it is, the stock is down about 4% following the release but showing signs of support at the 150-day moving average. If the stock can sustain this level, it should move sideways at the bottom of the 2023 range with a possible move higher.