The Dogs of the Dow theory assumes that this year’s worst performers will be the best-performing stocks in the next. If not, they should provide solid rebounds due to their “lower” value, and many pay above-average dividends. This year, the Dogs of the Dow list includes three high-yielding stocks with an average payout above 6.0%. All three are set up for rebounds, making them better-than-average targets for Dog investors. The question is when the rebound will happen and what it means to investors in 2024.
Walgreens is the highest-yielding Dow Dog in 2023
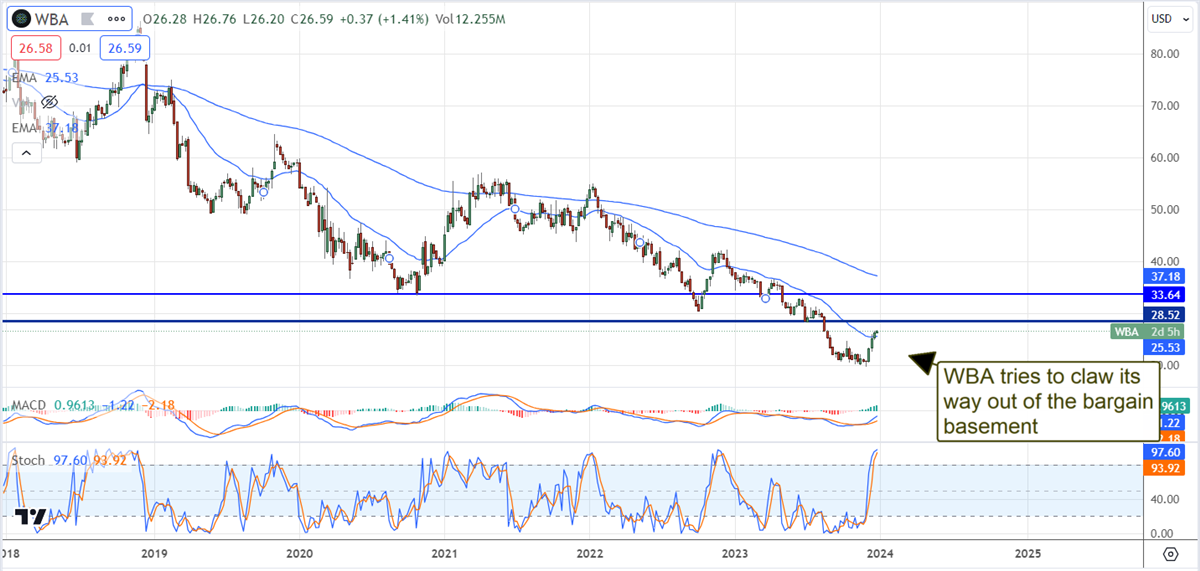
Walgreens (NASDAQ: WBA) is the worst-performing Dow stock in 2023. The company stock is down about 30% from the first of the year and still within a solid downtrend. The caveat is that a new CEO took over in October and is expected to drive a significant turnaround in the business.
Regarding Q4/calendar Q1, the company is expected to post a YOY increase in revenue offset by narrower margins. The upshot is that business will likely improve as the year progresses, with a chance for earnings growth in the back half. In the long term, Walgreens is expected to grow top and bottom-line results in F2025.
Among the drivers of the stock price in 2024 is a potential sale or spin-off of Boots. The company has tried to separate Walgreens and Boots but failed due to concerns over the legacy Boots pension plan. Those fears may have been put to rest last month when Legal & General bought into the plan, securing the benefits for all 53,000 members. Boots is valued at up to £7 billion but could go for as little as £5.5 based on a report from the Financial Times. R
Regardless, Walgreens-Boots Alliance dividend is relatively safe. The stock pays out more than 7%, with shares trading at only 8X earnings; the payout is less than 60% of the earnings forecast. Analysts rate the stock at Hold and see it advancing 10% at the consensus. The caveat is that consensus is trending lower and may not have hit bottom.
3M is turning a corner
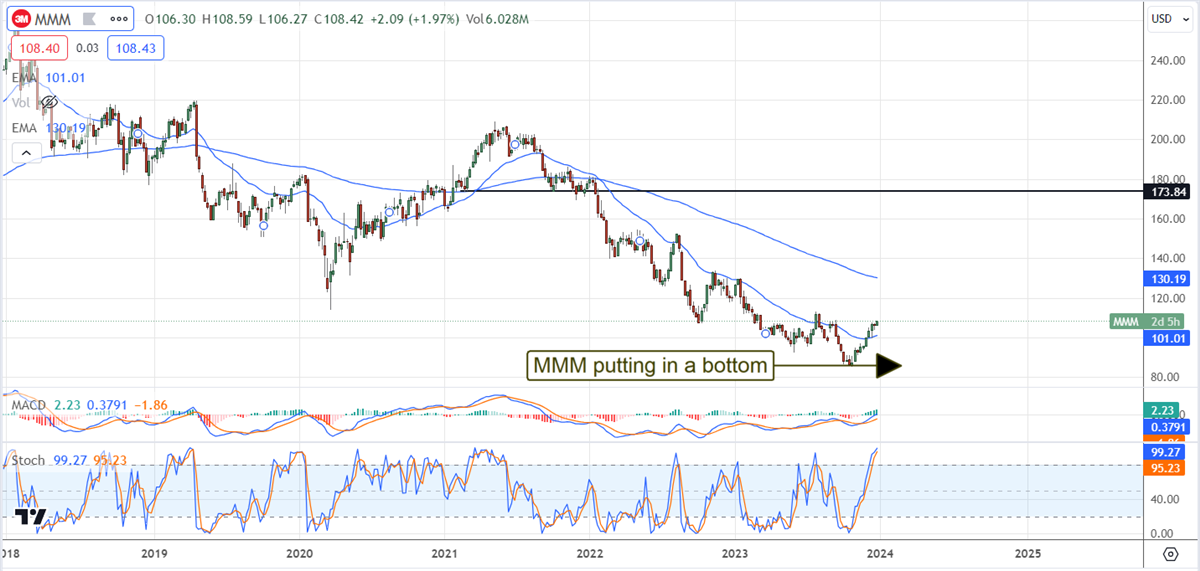
3M (NYSE: MMM) is the 4th worst-performing Dow stock in 2023 and the 2nd highest yield. The stock pays about 5.5%, with shares trading near 12X earnings with significant hurdles evaporating. Among them are lawsuits centered on hearing protection devices and forever chemicals that have been settled or are fizzling. The company settled for claims in the hearing device suit and some cases with Forever Chemicals, while a major class action regarding Forever Chemicals was deemed meritless. The salient point is that cash and cash-flow concerns have been alleviated, allowing investors and executives to focus on business and a return to growth.
Analysts expect a YOY decline in Q4 revenue, but two factors offset the decline. The first is that the margin is expected to improve significantly, resulting in YOY growth on the bottom line, and the consensus for 2024 is solid. The analysts forecast about 3.5% top-line growth compounded by a wider margin. Analysts rate MMM stock a consensus Reduce, but a recent shift suggests a bottom in sentiment. Several upgrades and price target increases have emerged since the summer, and more are expected over the coming quarters.
Verizon is getting re-rated, shares are advancing
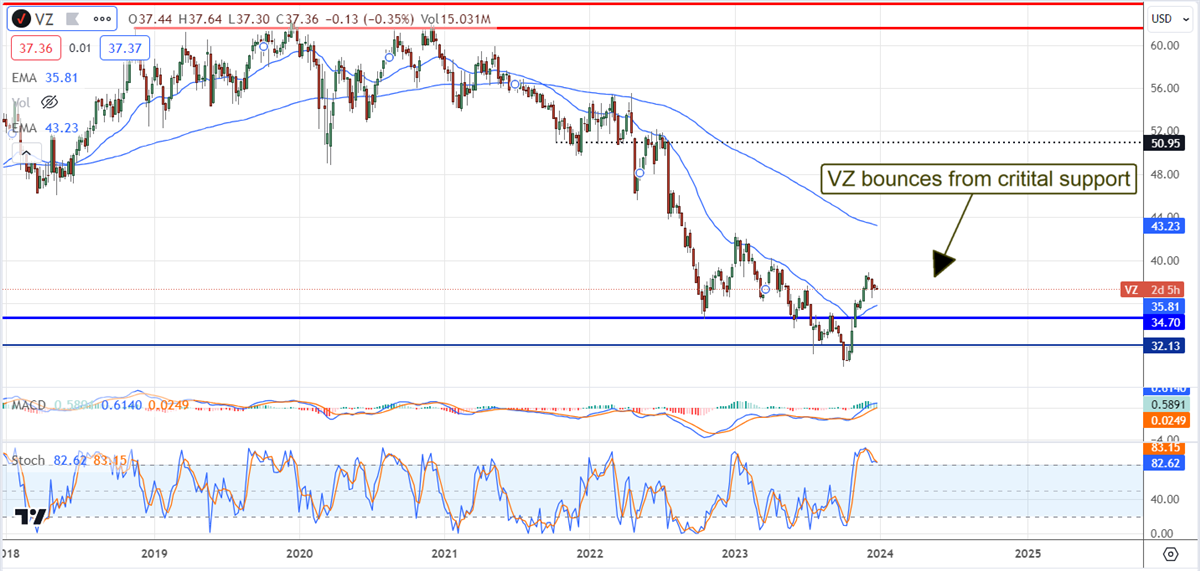
The price action in Verizon (NYSE: VZ) trended lower for more than a year on growth concerns, but the move was overdone. The stock fell into deep value territory, where it still resides. The stock is trading at 8X earnings and is still below the analysts’ lowest price target, leading the market higher. Recent analysts' actions suggest the low-end, consensus, and high target will increase in 2024.
As it is, this communications stock is rated at Moderate Buy with a target of about 12% above the current action. That level puts the market at a one-year high consistent with 2023’s opening trades and on track to move higher. The next significant hurdle is the one-year high at $42.25, a move above that would confirm a complete reversal in the market. Until then, Verizon yields about 7.1% and has a positive outlook for distribution increases.