Stellantis NV (NYSE: STLA) is the world’s third largest automaker behind Toyota Motor Corp. (NYSE: TM) at number two and Volkswagen AG (OTCMKTS: VWAGY) at number one. The company was born from a merger between Fiat Chrysler and the French PSA Group in January 2021. While Stellantis may not sound familiar to you, some of its 14 brands will.
Its brands range from Alfa Romeo, Chrysler, Dodge, and Jeep to Maserati, Peugeot, and Ram. Ram Trucks is a stand-alone brand for what used to be Dodge trucks. The company is set on leading the electrification and decarbonization movement with its Dare Forward 2030 strategic plan.
Electrification and Decarbonization
Stellantis has targeted 100% of European and 50% of U.S. sales to be EVs by 2030. They plan to produce over 75 battery electric vehicles (BEVs) with annual sales of 5 million units by 2030. The company plans to achieve carbon net-zero by 2038.
Tesla Factory Automation
Automation has been a critical component in improving manufacturing efficiencies. Comau Robotics is an Italian industrial robotics and automation systems company owned by Stellantis. They have a history of supplying automation systems for Telsa Inc. (NASDAQ: TSLA) vehicle manufacturing facilities.
They signed a new deal in 2021 to outfit its Fremont facility with robotics and automation equipment. The California facility is the only one that manufactures four Tesla models. Tesla will begin the quality control automation by installing two robots in its Fremont facility. This is based on a new permit submitted by Tesla for installing an Automatic Inspection System.
Full-Year 2022 Earnings Results
On Feb. 22, 2023, Stellantis released its full-year 2022. The company reported net profits grew 26% to €16.8 billion. Revenues were €179.6 billion beating €176.1 billion consensus analyst estimates. Adjusted operating income rose 29% to €23.3 billion with a 13% margin which beat its 2030 target of 12%.
Stellantis achieved net cash synergies of €7.1 billion, two years ahead of its €5 billion annual steady-state target. Stellantis was the number one EU30 commercial vehicle BEV sales and No. 2 EU30 overall BEV sales.
The company authorized a €1.5 billion stock buyback in the open market by the end of 2023. The company sees 5% top-line growth for 2023 in North America, Enlarged Europe, Middle East & Africa, and India and Asia Pacific. Global EV sales rose 41% YoY to 288,000 vehicles in 2022. Its all-electric SUV Jeep Avenger won European Car of the Year 2023. The company confirmed locations to build five gigafactories, including three in Europe and two in North America.
A Value Investors Dream
One has to do a double-take when looking at Stellantis' valuation. The company has around $15 per share in cash with a 6.23% annualized dividend and a forward P/E of just 4.2, trading at $17.50 per share and (only) €27.12 billion in debt. These metrics appear very cheap compared to General Motors Co. (NYSE: GE) at $39.27, trading at 6.35X forward earnings with a 0.92% annual dividend yield and $19.58 cash per share, and $116 billion in debt.
Ford Motor Co. (NYSE: F) at $11.95 trades at 7.5X forward earnings with a 5.03% annualized dividend yield and $8.07 in cash per share, and $140.5 billion in debt. The dividend may be at risk.
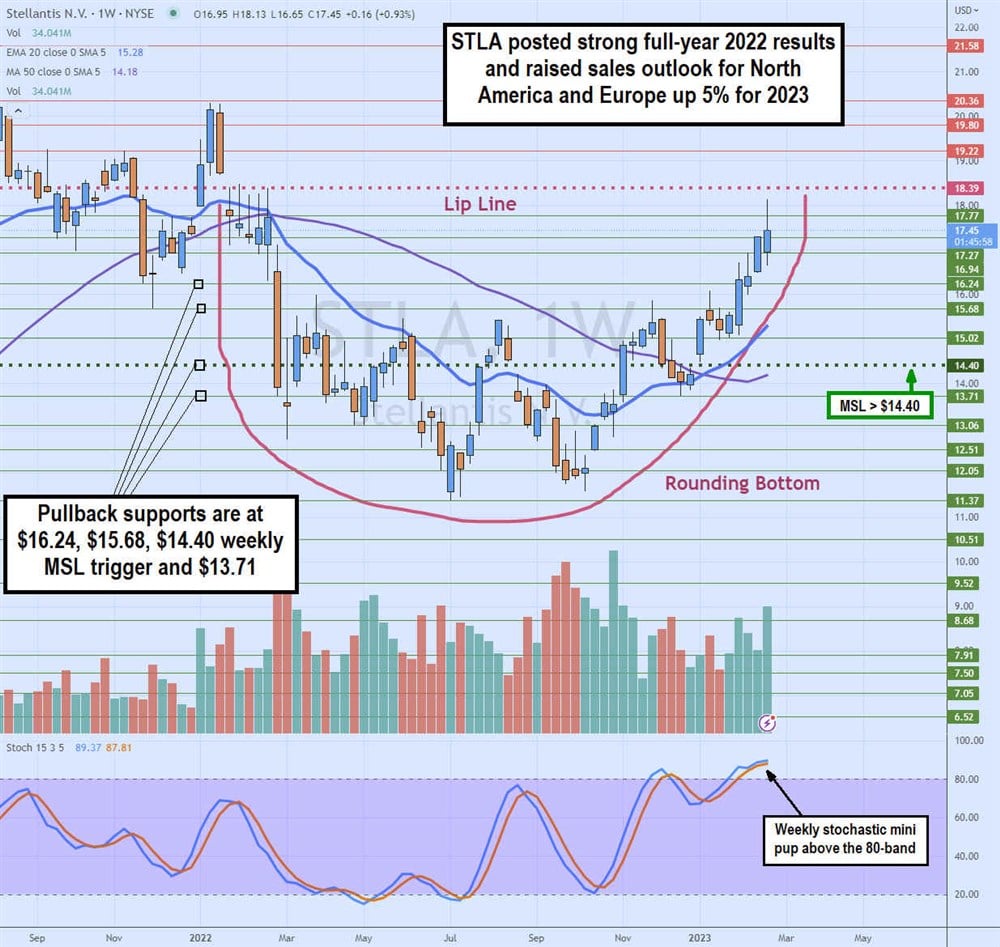
Weekly Rounding Bottom and Cup
The STLA weekly candlestick chart depicts the rounding bottom formed after bottoming out at $11.37 in July 2022. STLA triggered a weekly market structure low (MSL) breakout at $14.40 as it climbed towards the lip line at $18.39. This would also complete the cup and set up for a pullback and handle formation.
The weekly stochastic is above the overbought 80-band and may be attempting another push by way of a mini pup. The weekly 20-period exponential moving average (EMA) support is rising at 15.28, followed by the weekly 50-period MA at $14.18. Pullback supports are $16.24, $15.68, $14.40 weekly MSL trigger, and $13.71.


