Dividend King H.B. Fuller (NYSE: FUL) is not an exciting stock but can be a telling indicator of economic activity. The company makes glue and adhesives for all end market uses, a leading input for all industries. The company’s results don’t point to dividend cuts or suspensions but suggest an economic slowing in 2023. The primary segment affected is the housing and construction segment which is impacted by high inflation, rising rates and low inventory.
That’s no surprise. Given the Fed's stance on inflation, the housing industry is on the brink of a double-digit contraction in economic activity that could be more severe than forecast. RH (NYSE: RH) results echo this sentiment; it expects conditions to worsen for the housing market before they improve.
“Additionally, inflation that was thought to be “transitory” is now deemed “persistent” by the Federal Reserve, resulting in a record rise in interest rates triggering a dramatic decline of the housing market, with luxury homes sales down 45% in the most recent quarter versus a year ago. Add to that an underperforming stock market and a banking crisis no one saw coming. The data points to business in our sector likely getting worse before it gets better,” said RH in its letter to shareholders.
H.B. Fuller Prepares For Slow Year In 2023
To say the least, H.B. Fuller’s Q1 results were mixed, leaving the market less than enthused about the outlook. The company reported $809 million in revenue, down 5.5% YOY, and missed the consensus estimate by 200 basis points despite higher realized prices. The decline is due to de-stocking among retailers in the Construction Adhesives segment and softness in all other categories. Total volume is down 10.8% and only partially offset by higher prices. The other segments, Hygiene, Health & Consumables and Engineering Adhesives, posted YOY growth but slower than expected.
The company’s gross margin widened by 190 basis points, but this improvement was more than offset by increased SG&A, interest expenses and FX translation. Interest and FX alone account for $0.28 in EPS, and those issues are not going away soon. The earnings also missed the Marketbeat.com consensus estimate by 1000 basis points, and the outlook is iffy.
The company is guiding for YOY revenue and earnings growth but is also preparing for a slowdown in the construction business. Prep includes realigning the cost structure and manufacturing capacity to align with demand and restructuring debt. These efforts are expected to drive margin improvement sequentially throughout the year and drive 3% to 13% adjusted EPS growth. The bad news is that 3% to 13% is below consensus at the high end of the range, and the guidance might be optimistic.
H.B. Fuller’s Dividend Is Safe
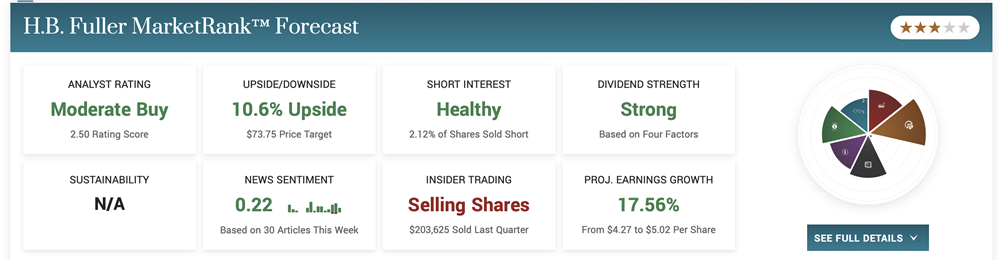
As mixed and murky as the outlook is, H.B. Fuller’s dividend is safe. The company is paying only 18% of the low end of its guidance range, leaving ample room for increases, if not large ones. The recent debt restructuring left the company with a more favorable cost structure that aids dividend safety.
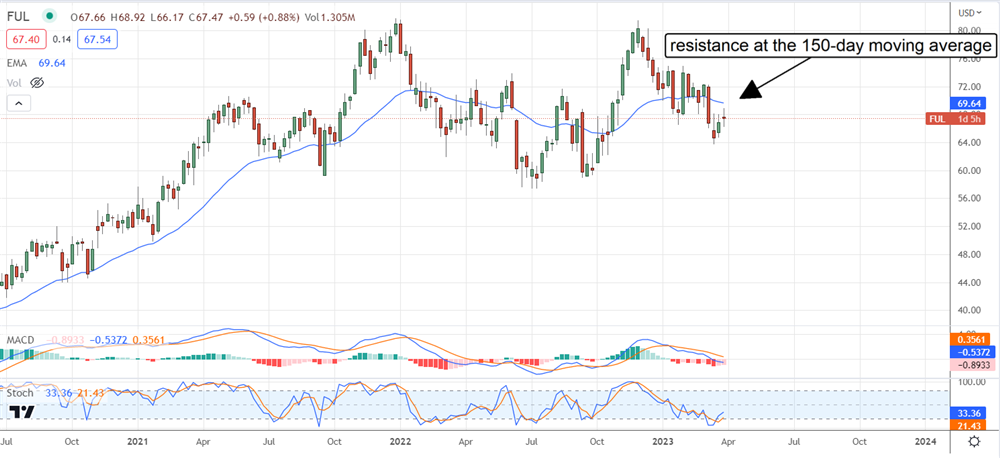
The Technical Outlook: H.B. Fuller Moving Lower Within A Range
H.B. Fuller shares are down following the Q1 release and may move lower. The action shows resistance at the 150-day moving average, which will cap gains until later in the year. The next stop is likely near $60 and the low end of the range where support should be strong. If this stock can’t hold at $60, moving to the pre-pandemic price point near $50 is possible.