Brazil’s third-largest airline Azul S.A. (NYSE: AZUL) is back from the dead thanks to NASDAQ: UAL">surging travel demand and an improved capital structure. The carrier delivers passengers and cargo. This under-the-radar airline has seen double-digit improvement in its operating metrics YoY and even more powerful performance over pre-COVID 2019 levels.
The company has hit record unit and NASDAQ: UAL">total revenues, doubling its logistics business while expanding its routes and destinations while paying down debt. It's achieved this despite NYSE: PFE">COVID-19, devalued currency, 20% inflation (yes, 20%), triple-digit fuel price rises, and no help from government support.
Accolades
Azul was voted Tripadvisor Inc. (NASDAQ: TRIP) NASDAQ: UAL">Travelers Choice award for World's Best Airline, Best Airline in Latin America, and World's Best Economy Class in 2020. It was called the World's Most On-Time Airline in 2022 by Cirium, an aviation data and analytics provider. Granted, not many people were flying in 2020 during the pandemic. Azul shares are trading well below their 52-week highs of $16.89. United Airlines Holding Inc. (NYSE: UAL) is trading just below its 52-week high of $54.87.
Savvy Negotiating to Improve Capital Structure
The company negotiated with its lessors, representing nearly 80% of its debt and 90% of its lease obligations. They’ve agreed to give lessors a tradeable 2030 maturity note and equity. Lessors will reduce lease payments by eliminating COVID-related deferrals and the spread between the company’s contractual lease rates and current market rates.
The result will eliminate its projected cash gap in 2023 to be cash flow positive in 2024 for record revenues of R$20 billion and EBITDA over R$5 billion in 2023. The company kept all aircraft and had 12 more delivered in the past five months.
Business Units Growing
The company’s loyalty program doubled TudoAzul doubled its gross billings. Its cargo and logistics business Azul Cargo grew 153% versus pre-COVID 2019. It became Brazil's largest domestic air logistics provider by the end of 2022. Azul Viagens grew revenues by 90% to R$1.3 billion in gross bookings in 2022 compared to 2019. An independent firm appraised its business units at R$25 billion.
A Recording-Breaking 2022
On March 6, 2023, Azul released its fiscal 2022 fourth-quarter 2022 results for December 2022. The company reported an earnings-per-share (EPS) loss of (R $0.83). EBITDA was R$1.10 billion, up 6.9% YoY with 25% margins. EBITDA was (10.7%) compared to Q4 2019 due to a 115.8% increase in fuel, 27.7% devaluation of the Brazilian real, and over 20% inflation over the previous three years. Revenues grew 19.4% year-over-year (YoY) to R$4.5 billion.
Revenues rose 36.9% compared to Q4 2019. Full-year 2022 operating revenue grew 39.4% to R$15.9 billion, up 59.9% versus full-year 2021 and up 39.4% versus full-year 2019. Gross debt fell from R$1.2 billion to R$21.8 billion for 2022. Azul ended 2022 with R$ 2.5 billion in liquidity.
PRASK, RASK, and CASK
Passenger Revenue per Available Seat Kilometer (PRASK) grew by 10%, and Revenue Per Available Seat Kilometer (RASK) by 8% YoY. PRASK measures passenger revenues, and RASK measures cargo revenues and hits record levels in the quarter with a 4.8% growth in passenger traffic and a 10.3% capacity increase YoY. Cost Per Available Seat Kilometer (CASK) considers expenses like fuel, labor, maintenance, airport fees, and financing costs. CASK rose 11.1% YoY to R$0.37 in Q4 2022, primarily due to rising fuel costs.
Upbeat CEO
Azul CEO John Rodgerson commented, “We are excited and optimistic about what we see in 2023 and beyond. For the year, we expect to generate record revenue of R$20 billion and record EBITDA of more than R$5 billion, around 40% above 2019. With the support of these strong operational trends, we have focused on implementing a comprehensive long-term plan, described below, to address the remaining Covid-related effects in our capital structure.”
Expectations for 2023
The company is "encouraged" by the robust travel demand and will start flying its expanded network at the downtown Congonhas airport in San Paulo. It will be doubling its flights to 84 daily. Its international capacity is expected to fully recover in 2023 due to its new destinations and routes, including Curacao and Paris. New flights to the U.S. are also being added from Recife, Below Horizonte, Manaus, and Belem. Azul expects it to hit the largest EBITDA and highest margins in 2023.
The Market MarketRank™ Forecast gives AZUL two out of five stars and a 67.1% upside price target of $9.78 per share.
Recovering from the Weekly Bear Flag
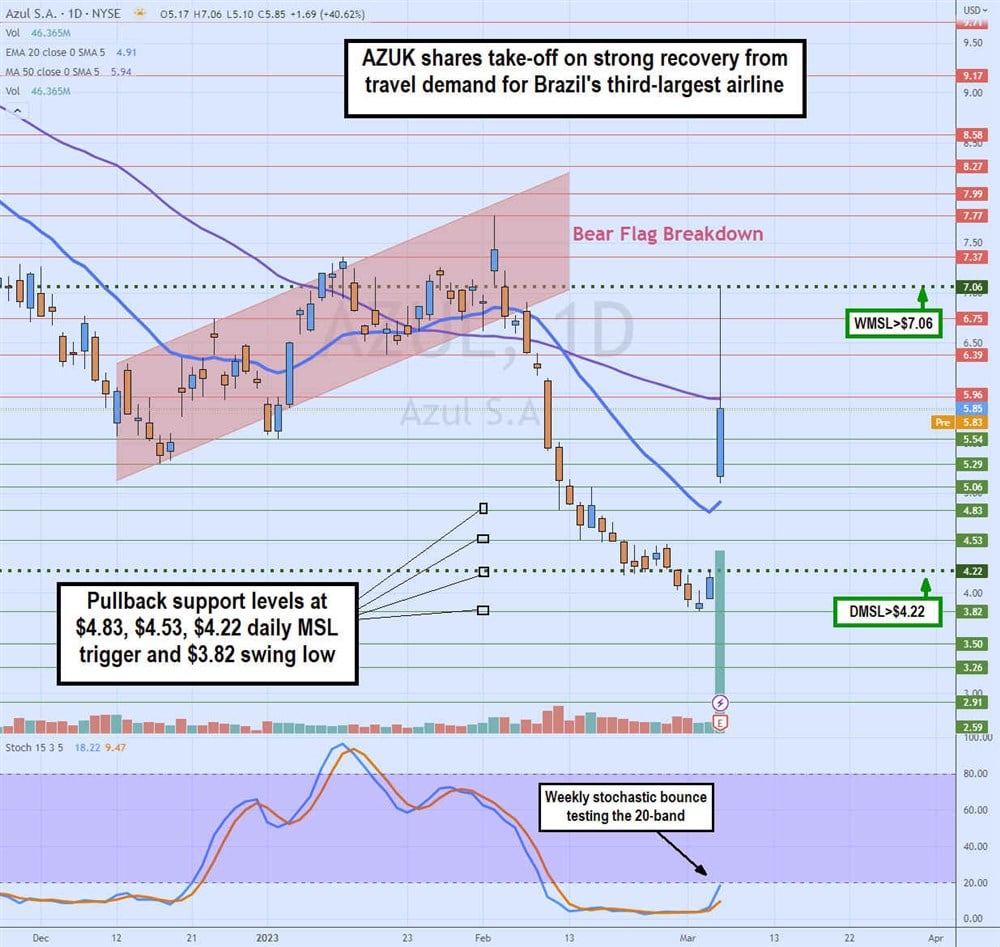
The daily candlestick chart on AZUL illustrates the bear flag setting up as shares recovered off $5.54 on Dec. 22, 2022, making higher highs on bounces and higher lows on pullbacks. This flag formation continued to rally until peaking at $7.11 on Feb. 1, 2023.
Shares fell back down to the lower daily flag trendline attempting to bounce but failed and fell out of the flag on Feb. 7, 2023, triggering the daily bear flag breakdown. AZUL sold for over a month, finally making a bottom at $3.82 on March 2, 2023.
The daily stochastic finally bounced to the 20-band as the daily market structure low (MSL) triggered the gap up through $4.22 on the earnings beat. AZUL shares rallied back to form a weekly MSL trigger at $7.06. It recovered what it lost for the past month in a single day. Pullback support levels are at $4.83, $4.53, $4.22 daily MSL trigger, and $3.82 swing low.


