Data storage solutions giant Seagate Technology Holdings PLC (NYSE: STX) stock got smoked due to its disastrous fiscal Q3 2023 earnings report. The company appeared to be nearing the end of its normalization as outlier demand spiked sales during the pandemic leading to an inventory glut after the reopening. Seagate indicated in its fiscal Q2 2023 earnings report that enterprise and cloud companies were working through bloated inventories.
Fast forward to fiscal Q3 2023, and the company bombed earnings by a mile and pushed back the demand recovery forecast towards the end of the calendar year. The China zero-COVID restrictions were finally lifted, and macroeconomic conditions were possibly starting to improve.
Was The Disaster Telegraphed?
Seagate shareholders recall when the company drastically lowered guidance twice in five weeks at the end of 2022. Its fiscal Q2 2023 still showed a profit and signs that normalization might have ended. That sentiment was shattered on its fiscal Q3 2023 earnings report. The shortfall in Seagate's earnings may have been telegraphed because DRAM Micron Technology Inc. (NASDAQ: MU) had one of its worst quarters in memory. Competitor Western Digital Co. (NYSE: WDC) will likely echo Seagate's forecasts for a later-than-expected demand recovery.
Surprise Flounder
On April 20, 2023, Seagate released its fiscal third-quarter 2023 results for the quarter that ended in March 2023. The company reported a non-GAAP diluted earnings-per-share (EPS) loss of ($0.28), missing consensus analyst estimates for a profit of $0.21 by ($0.49). GAAP diluted EPS loss was (-$2.09)—cash flow of $228 million from operations and free cash flow of $174 million. Revenues fell (-33.6%) year-over-year (YOY) to $1.86 billion, missing analyst estimates of $1.98 billion.
Remember that in its prior quarter, fiscal Q2 2023, Seagate kept its fiscal Q3 2023 guidance flat with an EPS expected between $0.05 to $0.45 versus $0.30 consensus analyst estimates. They completely bombed with losses instead of profits.
CEO Insights
Seagate CEO Dave Mosely stated they're seeing a "more elongated customer inventory correction" driving to weak demand among a few significant customers at the end of the quarter. March quarter fell to the low end of revenue guidance combined with underutilization charges, severely impacting margins and profitability.
He commented. “Looking ahead, we now expect demand recovery to begin towards the end of the calendar year. In response to this dynamic environment, we are taking aggressive actions to lower our cost structure while still positioning Seagate to thrive over the long-term and sustain our technology leadership. To that end, we continue to execute on our product roadmap, including our strategically vital HAMR platform that we launched in April, as anticipated.”
Lowering Expectations
Seagate lowered its fiscal Q4 2023 EPS guidance, expecting between ($0.40) to $0.00 versus $0.50 consensus analyst estimates. It expects revenues between $1.55 billion to $1.85 billion versus $2.06 billion analyst estimates. Two of the three headwinds the company cited in the prior quarter are still active. The China zero-COVID restrictions are being pulled, but the weak macroeconomic climate and bloated enterprise inventories are still weighing heavily on the demand glut. Seagate Technology analyst ratings and price targets can be found on MarketBeat.
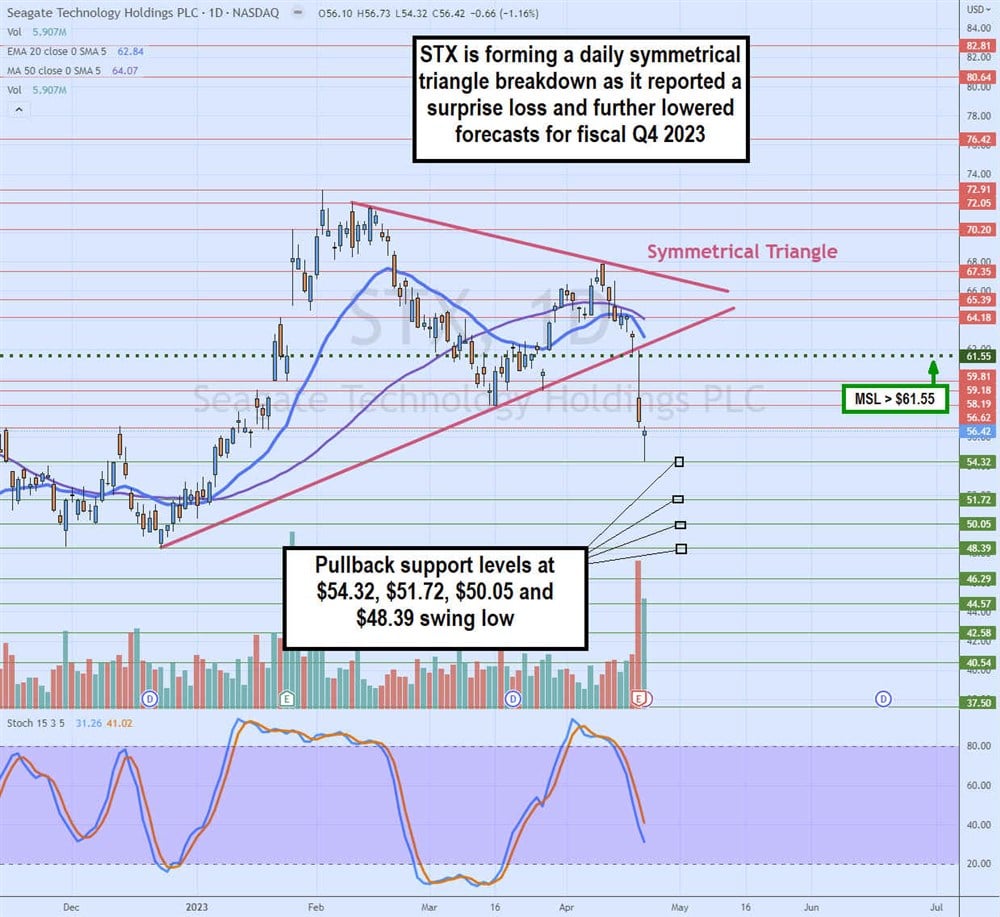
Daily Symmetrical Triangle Breakdown
The daily candlestick chart for STX illustrates a symmetrical triangle that commenced after making a $50.05 swing low on December 22, 2022. Shares rallied up to $72.91 on Feb. 2, 2023, before sliding to a higher low of $58.19 on March 16, 2023. A second lower swing high at $67.82 was made on April 12, 2023, setting up the falling upper trendline as the rising lower trendline tightened the channel.
The fiscal Q3 2023 earnings disaster gapped shares below the symmetrical lower trendline and $61.55 daily market structure low (MSL) buy trigger on April 20, 2023. The daily stochastic formed a mini inverse pup complete oscillation toward the 20-band. Pullback support levels are at $54.32, $51.72, $50.05 and $48.39 swing low.