The insider buying activity is as interesting as usual, with some insiders selling and some buying. Among the more exciting details is that Warren Buffet started buying Occidental Petroleum (NYSE: OXY) again, but that was expected. The stock price fell back to what some have labeled The Buffet Buy Zone, below $60, and he did. Other details are also interesting. Among them are an uptick of insider buying among the regional banks and buying in 2 well-positioned companies with other catalysts working in their favor.
Regional Banks Are Getting Scooped Up By Their Insiders
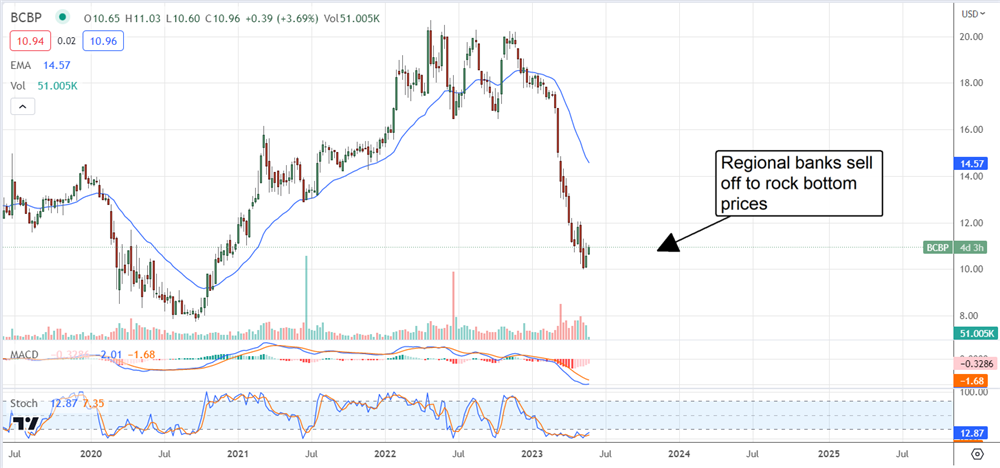
Regional banks are not just showing up on the list of most bought stocks but dominating it. The fallout from the SVB and FRC implosions may not have been fully felt, but the takeaway is clear. Many, if not most, of the regional banks are still in good shape and trading at rock-bottom prices, so it is not surprising to see insider activity picking up. The value is absurd in some cases and has the yields on the stocks up in the mid to high-single-digit range, and the distributions are growing.
The most bought stock in the group is BCB Bancorp (NASDAQ: BCBP). It’s a regional bank headquartered in New Jersey with a market cap of $175 million and a valuation of 4X earnings. That gets a yield of 6% and a distribution that has increased for the last 2 years. The payout ratio is only 25%, a low figure, suggesting increases will continue. Independent Bank Group (NASDAQ: IBTX) and Business First Bancshares (NASDAQ: BFST) are a step and 2 steps larger than BCB Bancorp and garner higher valuations because of it. Still, at 9X and 6.7X earnings, they are a relative value with yields in the range of 4.6% and 3.25%, and both have grown their distributions for several years. All 3 are rated at least at Hold with double-digit upside potential.
Rayonier Advanced Materials, You're Using Their Product Now
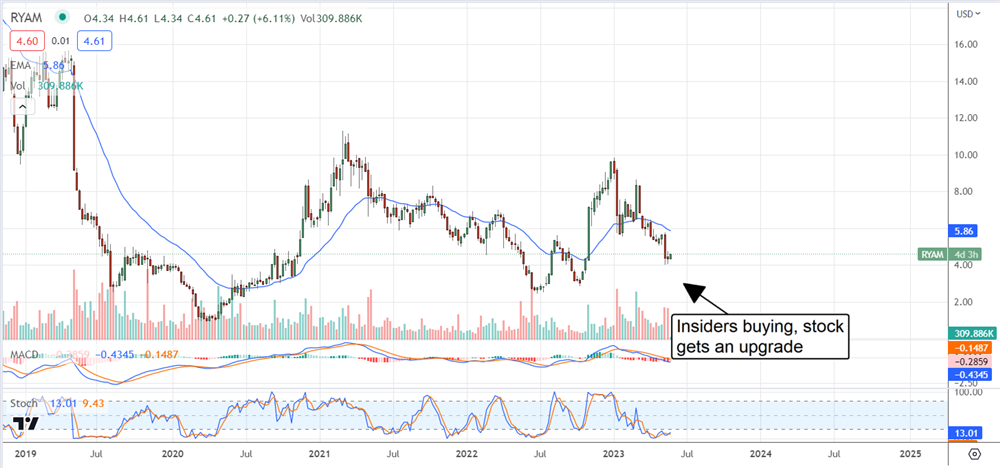
Rayonier Advanced Materials (NYSE: RYAM) is a near-penny stock founded in 1926. The company makes many cellulose-based products that manufacturers and industries use across segments and verticals. Aside from the paper and cardboard applications, cellulose is used to keep things dry and non-sticky, and there are hundreds of applications in manufacturing. And the stock was recently upgraded. RBC upgraded the stock to Outperform after it refinanced some debt. The refinancing frees up cash flow and will allow it to pursue growth, but, more importantly, it will drive margin improvement and bottom-line results.
Coincidentally, after 2 years with no buys or sales, insiders are buying the stock again. The CEO, CAO, and 4 individual directors bought $400,000 worth of shares bringing the total insider holdings to over 3.0%. This is compounded by institutional activity, which is picking up and has been strongly bullish for the last 2 years. The institutions own about 75% of the stock.
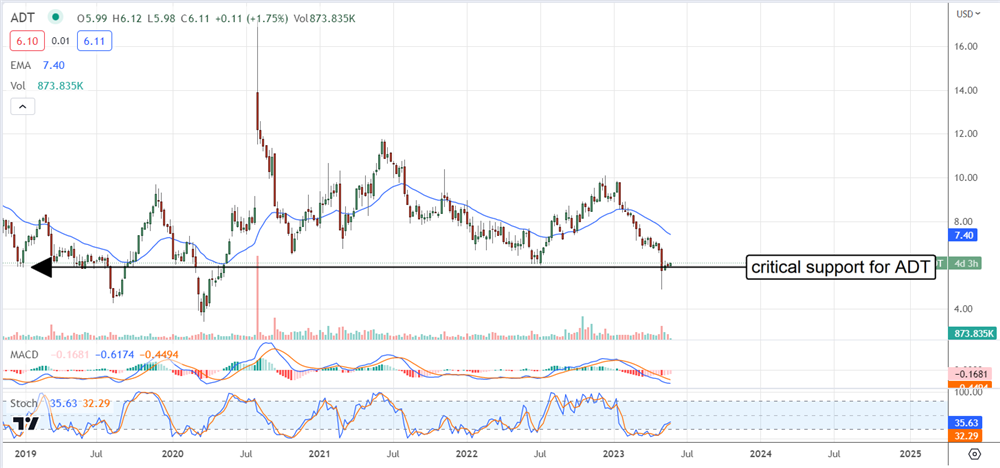
ADT: Insiders Bought The Dip
ADT (NYSE: ADT) share price imploded after the last earnings report, but the insiders bought the dip. Mixed results caused the dip and what was perceived as weak guidance, but that’s relative to expectations. The CQ1 revenue was weak but offset by a better-than-expected margin and earnings. Despite the mixed results, the FY year guidance was reiterated, which is good news, except the analysts wanted more. The question is if the analysts were expecting too much because the company is standing pat with its initial outlook.
Regarding the insiders, 5 insiders have made 5 purchases since the start of the year for a total of nearly $1.0 million. This is offset by a $49,000 transaction by EVP David Smail, but Mr. Smail is 1 of the buyers and wound up repurchasing more shares than he sold at a lower price. They own about 2.5% of the stock; all purchases occurred after the share price fell and have helped to signal a support zone.