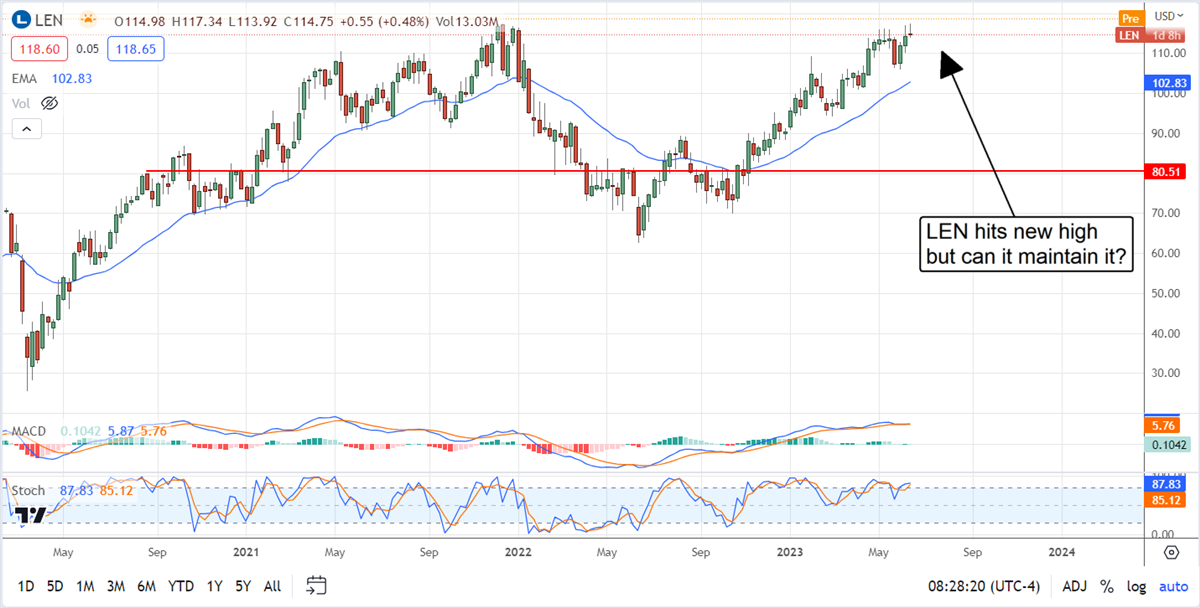
The homebuilders, Lennar included (NYSE: LEN), have been defying the odds for the last year and more. They’ve produced robust performance relative to the analysts' expectations, which has increased their share prices. In Lennar’s case, that means a move up to and almost above the all-time high. The post-Q2 earnings release action has the stock back up to an all-time high and on the verge of breaking out.
If the market can sustain the move, it could lead to a sustained rally, but there are risks. Homebuilders are not immune to the high-interest rate environment. High rates have an impact on demand, and that is seen in the data. Declining interest and backlogs suggest the industry will soon normalize, which could cap gains for the market.
Lennar Has Solid Quarter Drive By Backlog Reduction
Lennar had a solid quarter with revenue, margin, earnings, and guidance above the Marketbeat.com consensus estimates. The company also produced growth in new orders but not enough to offset the increase in deliveries and end the drawdown of backlogged homes. That scenario suggests the period of strength is ending quickly, and the pace could be accelerated later this year.
The company says demand ebbs and flows with week-to-week changes in interest rates, picking up when rates are lower, and the FOMC has indicated 2 more rate hikes are coming this year. That puts interest rates up another 50 basis points on average and potentially high enough to keep all but those who have to move from buying a new home.
Stuart Miller, Executive Chairman of Lennar, said, "During the quarter, we continued to see the housing market normalize and recover from the Fed's 2022 aggressive interest rate hikes in response to elevated inflation. As consumers have come to accept a "new normal" range for interest rates, demand has accelerated, leaving the market to reconcile the chronic supply shortage derived from over a decade of production deficits.”
The company reported $8.05 billion in sales, down 3.7% YOY despite a 3% increase in deliveries. A 7% price decline offset the increase, -10% from the bubble's peak, and the “strength” was driven by a backlog reduction. The company’s backlog is down 30% YOY, 35% on a dollar basis, and it fell during the quarter.
New Orders increased but only by 1% compared to the 3% increase in deliveries, which is expected to continue over the summer. The guidance is favorable; it expects sequential growth and a YOY increase in deliveries, but not enough for YOY growth. The 5.6% increase in deliveries (at the top end of the range) does not offset an expected 8.5% decline in average selling price or a 600 basis point decline in projected gross margin.
Lennar Produces Cash, Pays Investors
Lennar is a cash-generating machine despite the headwinds to growth. The company generated $872 million in net earnings for a margin of 10.8%, and much of that was used to improve shareholder value. The company repurchased $158 million in debt and $208 million worth of shares and paid dividends. That allowed for a capital improvement on the balance sheet, and this type of activity is expected to continue.
The release has the market up at a new high in pre-market trading. The question is whether the high will be maintained or profit-taking will cap the market. In the 1st case, the break out could take the market up another $25 to $35, although that is unlikely. In the 2nd case, the market will be capped at the bubble's peak and may become range bound. The 17 analysts rating the stock at Hold think it’s fairly valued right where it is.