Dividend King H.B. Fuller (NYSE: FUL) issued what can only be called a weak report, but shares are rising. It takes a little digging, the news that has the market moving higher is far down in the report, but the details add up to 1 thing: leverage. The company has worked to raise prices and cut costs, which widened the margin. Execs also see “tapering” of destocking activity across the broad portfolio, which suggests volume will improve within the next few quarters.
This boils down to a lever for earnings growth when volume picks up, which is why shares are rising. H.B. Fuller is a Dividend King with a low payout ratio and earnings leverage in the forecast, and that suggests dividend health and the potential for aggressive distribution increases.
“Our confidence remains high in a stronger second half performance as we expect customer destocking activities to fade, EBITDA margins to continue to expand due to price and raw material cost management, demand in China to improve, better foreign currency comparisons, and restructuring benefits to ramp through the end of the year,” said CEO Celeste Mastin.
H.B. Fuller: Weak Quarter, Optimistic Outlook
H.B. Fuller had a weak quarter, with revenue of $898.25 million falling 9.6% YOY and missing the consensus estimates by nearly 750 basis points. The decline is driven by a 14.2% decline in volume that was only partially offset by a 5.9% increase in price. The volume decline is contrary to activity in most sectors due to overstock and inventory buildup created during the pandemic. Construction led on a segment basis with a decline of 13.6%, followed by a 10.2% contraction in Engineering and a 7.6% decline in Hygiene, Health & Consumables.
The good news is the margin. The company margin improved at the gross and adjusted EBITDA levels to drive improved cash flow and stable earnings. The company’s cash flow improved by $94 million YOY, although the bottom line results do not reflect that. The adjusted $0.93 is down from last year’s $1.11 and missed consensus by $0.11.
Guidance isn’t spectacular, but it is helping to lift the market. The company reiterated its expectations for adjusted EBITDA growth of 9% to 15% but revised its revenue and earnings targets lower. The takeaway is that revenue and earnings are expected in a range bracketing the consensus, but there is ample room for the company to miss that target.
The next major catalyst may not come until later in the year when the company reports earnings for Q3. If it follows up with more positive margin development and commentary about industry normalization, the stock could rally to a new high.
The Institutional Tide May Have Shifted
With no analysts raising their sentiment, weak guidance, and barely enough short interest to move the needle, the question of who is buying the stock needs to be answered. The institutions have been selling for the last 12 months at a pace of more than 2:1, so it probably isn’t them unless it is. The stock is trading near long-term lows and offers relative value for yield and safety. With leverage and rebound entering the picture, the institutions, which own 93% of the stock, may have begun to buy again. If so, shares of the stock will likely move higher.
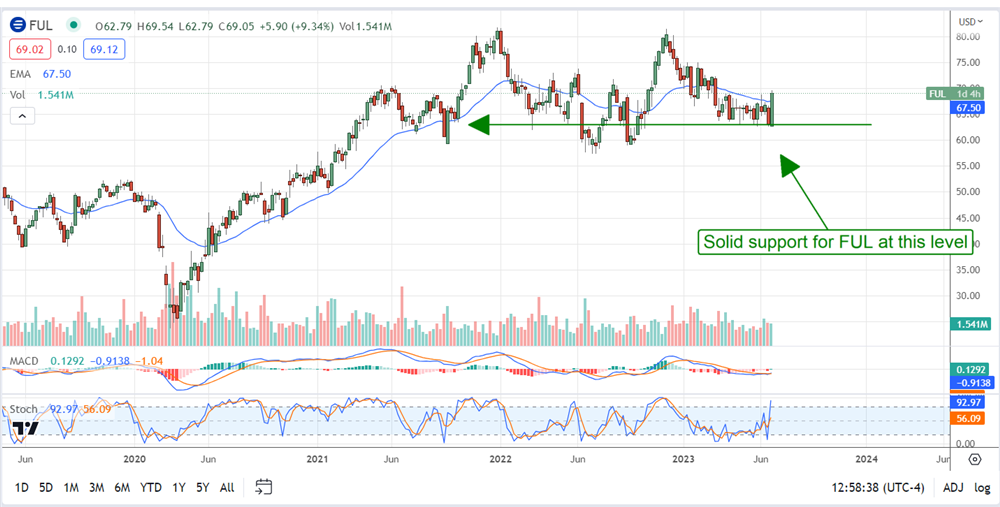
The technical outlook is bullish for this dividend king. The stock gained over 5%, exceeding the short- and long-term moving averages. The move is accompanied by bullish crossovers in MACD and stochastic that point to higher prices. Both are low in their ranges and suggest the move could have legs. If so, the all-time high near $80 could be a cautious target.