Specialty lifestyle apparel retailer Urban Outfitters Inc. (NASDAQ: URBN) stock has staged a turnaround along with its business. The company operates under many popular brands, including Anthropologie, Terrain, Free People, FP Movement, Nuuly, Menus & Venues Restaurants and Urban Outfitters.
Like most NASDAQ: URBN">retailers, the weakening economic environment had caused them to increase promotional activity to get merchandise out the door during the 2022 holiday season. As consumers pulled back on their discretionary spending, retailers had to pull out all the stops to get them buying again. That has reversed as the company is even marking up items while NASDAQ: LULU">shrinking its inventory.
Margin Expansion
Improvement in supply chains and falling freight costs have contributed to margin expansion for Urban Outfitters, which is expected to improve by 300 bps in Q2 2023. This has been echoed by competing retailers like Abercrombie & Fitch Co. (NYSE: ANF) and Lululemon Athletica Inc. (NASDAQ: LULU) as they return to margin expansion. They've trimmed markdown activities to reverse the margin compression of 2022.
Strong Top and Bottom Line Growth
On May 23, 2023, Urban Outfitters released its fiscal first-quarter 2023 results for the quarter ending April 2023. The Company reported a record earnings-per-share (EPS) of $0.56, excluding non-recurring items, versus consensus analyst estimates for a profit of $0.36, a $0.20 per share beat.
The gross profit rate increased by 260 bps. Gross profit dollars rose 14.8% to $371.2 million from $323.3 million in the year-ago period. Net income was $52.8 million hitting a record first-quarter EPS. Net sales rose 5% to a record $1.11 billion. Revenues rose 5.7% year-over-year (YoY) to $1.11 billion, beating consensus analyst estimates for $1.09 billion. Comparable retail net sales increased by 17% at the Free People Group and 13% for the Anthropologie Group but fell (13%) for Urban Outfitters.
Portfolio of Stores
The company opened five Free People Group stores, including two FP Movement stores, while closing three Urban Outfitters stores, one Anthropologie Group store and one Menus & Venues restaurant. As of April 31, 2023, the portfolio of company-owned stores includes 260 Urban Outfitters stores, 237 Anthropologie Group stores, 193 Free People stores which include 33 FP Movement stores, and 10 Menus & Venues restaurants.
Improving Gross Margins Moving Forward
Total inventory decreased by ($39.6 million) or 6% in Q1 2023. Total retail segment inventory fell (5%), and total wholesale inventories fell (23%), helping to boost gross margins. The gross profit margin for Q2 2023 should see a 300 bps improvement driven by higher initial product margins, lower freight costs, and fewer merchandise markdowns.
Urban Outfitters CFO Melanie Marein-Efron commented, “We have made significant progress over the past few quarters, controlling our inventory-to-sales ratio. In addition, an improved supply chain with faster speed and reliability than last year allows us to bring products closer to demand. As a result of well-controlled inventory and a healthier supply chain, we believe there could be lower markdowns in the second quarter…."
Barclays Upgrade to Overweight
On May 24, 2023, Barclays upgraded shares of Urban Outfitters to Overweight, raising its price target to $38 from $27. Analyst Adrienne Yih noted its Q1 2023 was solid across the board with positive inflections in its sales-to-inventory risk, improving inventories, and positive sales growth. She commented that URBN stock is among the "best positioned in a slowing consumer backdrop."
Urban Outfitters analyst ratings and price targets can be found on MarketBeat.
Weekly Cup and Handle Breakout
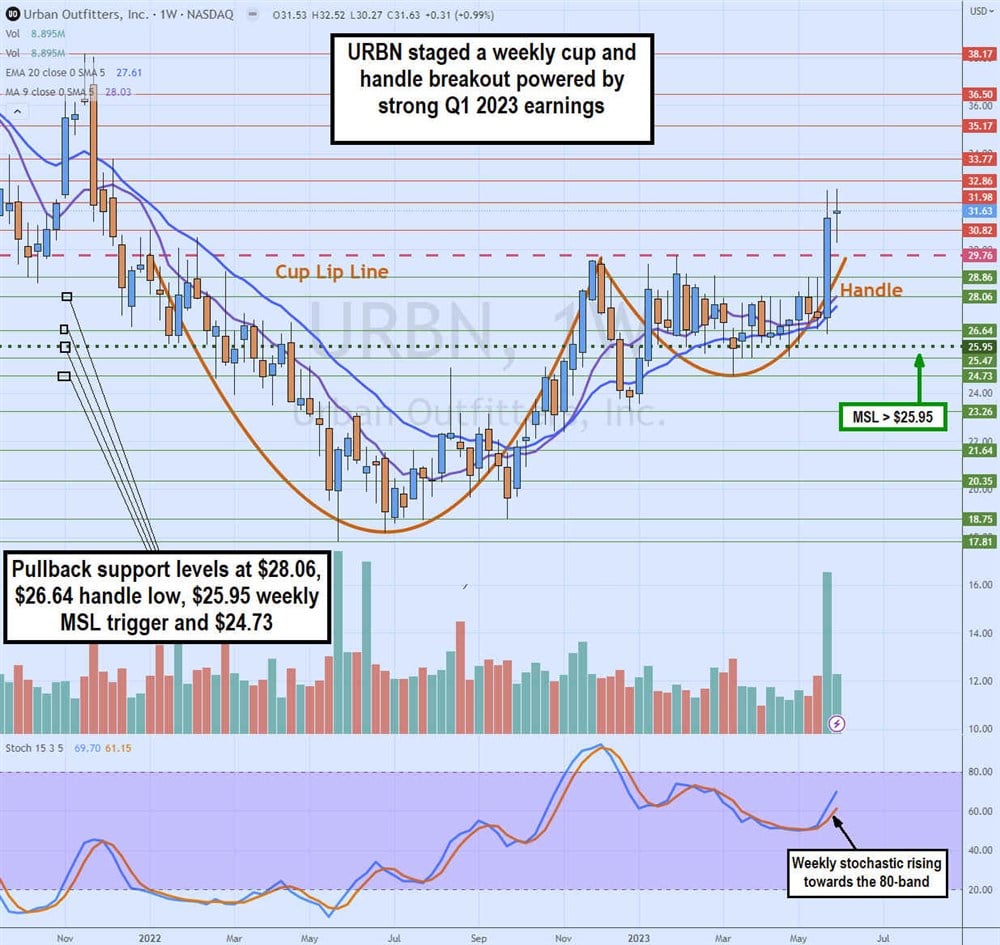
The weekly candlestick chart for URBN formed a cup and handle breakout. The weekly cup lip line commenced over a year ago, in January 2022, after peaking at $29.76. URBN shares drifted to a low of $17.81 in May 2022, eventually forming a rounding bottom that fueled a rally to retest the cup lip line in December 2022.
Shares rejected again off the $29.76 lip line falling to a low of $23.26 by late December 2022. URBN triggered a weekly market structure low (MSL) breakout through the $25.95 trigger to form a handle and barcoded in a range under the cup lip line until exploding higher in May 2023 on its Q1 2023 earnings report. Pullback supports are at $28.06, $26.64 handle low, $25.95 weekly MSL trigger and $24.73. The weekly stochastic is climbing towards the 80-band.


