The computer and office equipment giant HP Inc. (NYSE: HPQ) has been trading steadily higher this year, with the stock up over 22%. Shares of HPQ recently broke above a critical level of resistance, and investors will be paying close attention from now on to see if resistance can now turn into support. Over the last five days, shares are up close to 6%, and investors will hope that this is just the beginning as the stock approaches the next critical level of resistance, $35.
HP offers a wide range of products, technologies, solutions, and services to various customer segments, including individuals, businesses, government, and educational sectors worldwide. The company operates through two segments: Personal Systems and Printing. HP, formerly known as Hewlett-Packard Company, was founded in 1939 and is headquartered in Palo Alto, California.
The Consolidation Breakout
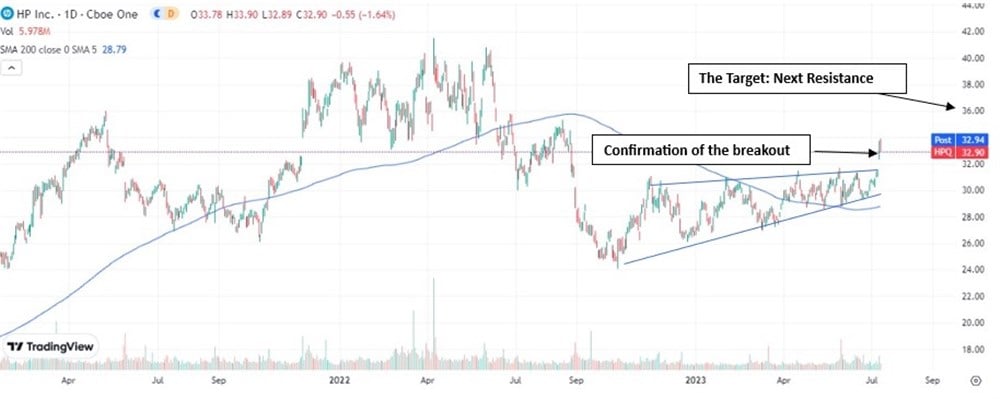
The stock is up 22.5% year-to-date after trending higher in the ascending wedge since the beginning of the year and a recent breakout through $32 resistance. Before breaking out, HPQ reclaimed the 200-day SMA, indicating a bullish shift in momentum. As $32 was the crucial resistance level for several months; bulls will now want to see the stock firmly hold higher without retesting that key area. The next target and level of resistance in HPQ is $36.
While the most recent price action is favorable for bulls, a bearish setup has formed on a higher time frame. A head and shoulders pattern has now emerged. If the stock can continue to base over previous resistance, then the bearish head and shoulders pattern will be of little concern. However, if the stock fails to hold above prior resistance and trades back in the range, the narrative could quickly shift to favor the bears.
Earnings And Outlook
HP surpassed analysts' expectations in its most recent earnings release on May 30th, 2023. The company reported earnings per share of $0.80 cents for the quarter, exceeding the consensus estimate by $0.04 cents. However, its revenue for the quarter was $12.91 billion, slightly lower than analysts' projected $13.07 billion. The company experienced a 21.7% decline in revenue compared to last year's quarter. Looking ahead, HP anticipates a 6.27% growth in earnings per share for the coming year, from $3.35 to $3.56.
Analysts Are Bearish
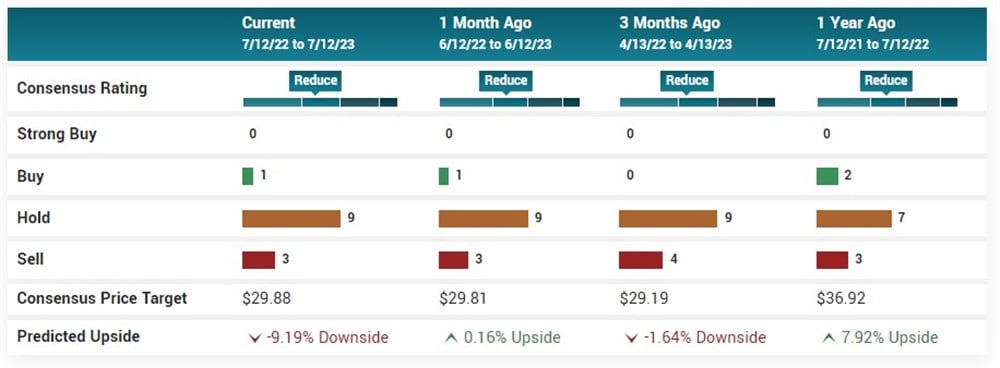
Analysts are bearish on the stock, with a consensus rating of Reduce, based on 13 analyst ratings. The consensus analyst price target is $29.88, predicting a 9.19% downside in the stock. Of the 13 analyst ratings, 3 are Sell, 9 are Hold, and only 1 has HPQ as a Buy. Most recently, Citigroup initiated coverage of HPQ with a Neutral rating and a $32 price target.
Insiders Have Been Selling
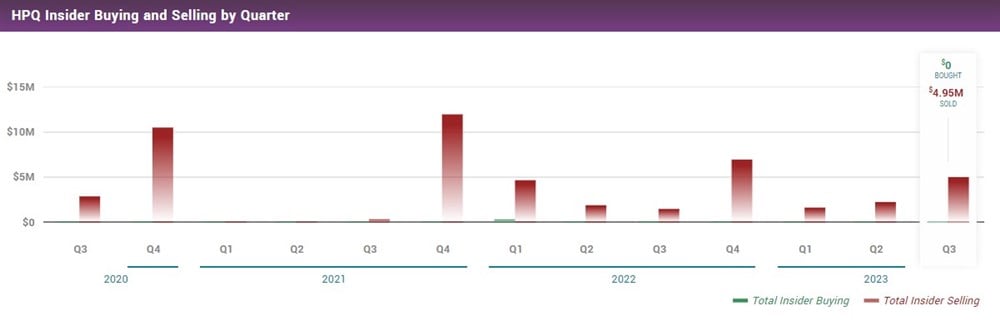
Over the last twelve months, insiders have sold $15.72 million of HPQ stock. The last time an insider purchased stock was in the first quarter of 2022. Since then, insiders have consistently sold stock each quarter. So far this year, insiders have sold $8.69 million, with $4.94 million occurring in the third quarter.
Most recently, the CEO sold 156,976 shares on July 3rd at an average price of $30.69, amounting to $4.8 million in proceeds.