The price action in Wendy’s (NASDAQ: WEN) stock was mixed following the Q2 earnings release, but everything within the report, along with the dividend and stock valuation, suggests it’s about to rocket higher.
Wendy’s trades at only 22X its earnings which is high relative to the S&P 500 but low compared to market-leader McDonald’s. McDonald’s trades above 25X its earnings while paying a lower yielding distribution, and Wendy’s is set up for a price multiple expansion.
A move to $25 would align the stock with its larger peer's valuation and the yield closer but still well above what McDonald’s pays.
Wendy’s is a high-yielding stock with a payout worth more than 4.5%, with shares trading near $21.50. There is some concern for distribution safety because the payout is slightly more than 100% of the F23 earnings guidance, but there are mitigating factors.
Among them is a significant and sustained (expected) improvement in the margin that has the payout ratio falling drastically over the next 2 years. Evidence of that is in the Q2 margin improvement and long-term guidance, which calls for high-single to low-double-digit FCF growth on a compound annual basis.
Until then, the 4.6% yield is backed up by solid operations and a healthy balance sheet that shows increased cash and assets and relatively flat debt compared to last year.
The Analysts Predict A Price-Multiple Expansion For Wendy’s
The analysts' activity in Wendy’s has been mixed this year, and no new updates are showing on Marketbeat’s tracking pages yet, but the takeaway is only bullish.
The 18 analysts with current ratings have the stock pegged at Hold, down from Moderate Buy compared to last year, but steady over the last 30 and 90 periods with an equally steady price target. The price target is the important factor here; the analysts are Holding the stock and see it trading about 15% above the current action or just above $25, flat on a YOY basis.
The Q2 results were mixed relative to consensus and may not spark upward revisions, but no negative commentary is expected.
The company posted $5.61 billion in net revenue for a gain of 4.4% compared to last year. The revenue missed consensus by less than 100 basis points, and a wider-than-expected margin offsets the weakness.
The International segment performed best regionally with growth of 12.7%, notable because this is the high-growth segment, followed by a 6.1% gain in the US. New stores and comp store growth underpinned the strength, which aided the company’s leverage.
The company opened 80 new stores in the quarter, and comps were in the mid to high-single digits for the US and internationally.
The company improved the margin across the system. The US company-owned restaurant margin was reported as 200 basis points better, with a 13.5% increase in operating profit for the entire business, a 23.7% increase in net income, a 40% increase in FCF, and a 17% improvement in adjusted EPS that all outpaced the top-line strength by wide margins.
Guidance Supports The Market For Wendy’s Stock
Wendy’s issued favorable guidance with the FY23 outlook in alignment with the consensus, and the long-term outlook for mid-single-digit top-line growth was reaffirmed.
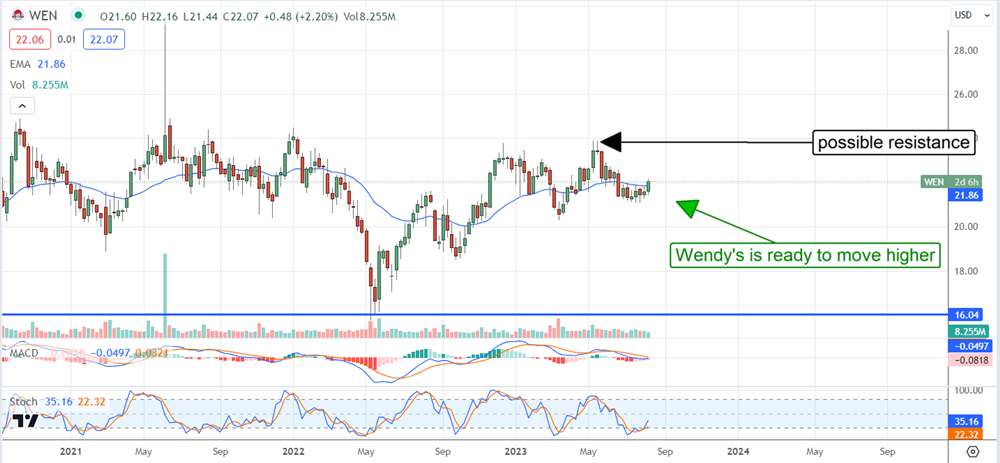
The price action was mixed following the news, but weak hands were shaken loose, and support was established at the 30-day moving average. This is a sign of growing interest among short-term and retail investors and could lead the market higher over the next few days, weeks, and months.
In that scenario, the market could easily move to the top of the trading range near $24 and even break to a new high. If not, this stock will remain range bound until there is more proof the international growth strategy is paying off.