While Target (NYSE: TGT) has been a bellwether of retail sector health in recent years, it is not today. The company’s lackluster results are due to its operational quality and lack of relevance in an environment where consumers are budget-conscious. Results from other retailers, including Walmart (NYSE: WMT), The TJX Companies (NYSE: TJX), and Williams-Sonoma (NYSE: WSM), show them growing, sustaining margin strength or widening margin and providing a healthy outlook for these trends to continue. The take on consumer health ex-Target is that strong labor trends point to a healthy spending season, with growth likely above the consensus estimates.
Target Results Aren’t All Bad: Shares Move to Rock Bottom Price Point
Target’s results are weak compared to the analysts' forecasts and the industry average, but not all bad for investors. The company sustained growth with revenue of $25.67 billion, up 1.15 year-over-year. The gain was made on a 0.3% comp driven by a 2.4% increase in traffic and a 10.8% increase in digital sales. Regarding brick-and-mortar traffic, beauty, food and beverage, and dailies remain areas of strength.
The margin news is also mixed with compression, compounding the top-line weakness. The gross margin contracted by 20 bps and the operating margin by 60 due to higher inventory costs, supply chain costs, and digital fulfillment. The net result is an adjusted EPS of $1.85, 2000 basis points shy of the consensus but still sufficient to sustain the company’s financial health and capital returns.
The guidance is equally bad, with comps expected to be flat compared to last year and positive forecasts from its competitors. However, the guidance also calls for EPS sufficient to sustain the capital return program if it dampens the outlook for the pace of buybacks. The full-year adjusted EPS target of $8.90 is $.60 shy of the consensus reported by MarketBeat.com but provides a sustainable dividend payout ratio of 52%.
Target’s Balance Sheet and Cash Flow Can Sustain Capital Returns
Capital return in Q3 included $516 million in dividends and another $354 in buybacks. The dividend is worth more than 3.5% in annualized return, with shares trading near long-term lows. The buybacks reduced the share count, down 0.2% for the quarter, and are expected to continue, if at a reduced pace, until earnings quality improves.
The cash flow and balance sheet highlights are good. The company’s cash flow was negative for the quarter but offset by YTD strength; cash is up, inventory is up, current and total assets are up, and liabilities are flat. Long-term debt leverage remains low at only 1x equity, and equity is rising, up by 15% compared to last year.
Analyst Sentiment Weighs on Target Stock Price
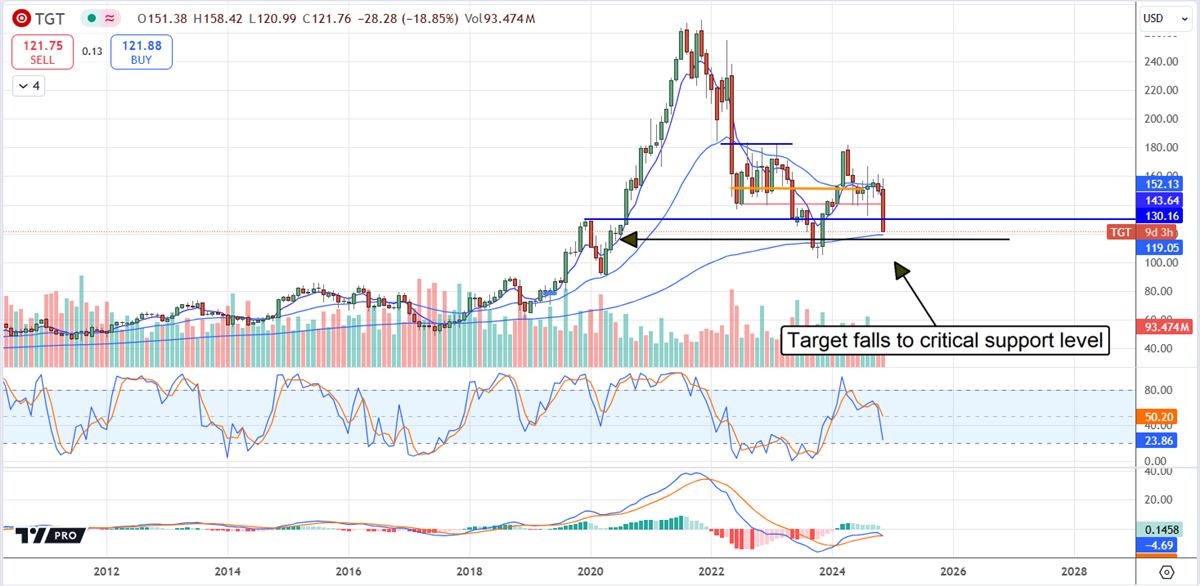
The initial response from analysts isn’t good, including two downgrades and price target reductions, but it could be worse. The new ratings are Hold, down from Buys, with targets of $108 and $130. The mid-point of that range aligns with the recent stock price lows and may provide a floor for the market. If not, this stock could set new lows and move significantly lower from there. In that scenario, Target's shares could enter a sustained downtrend from which it may never recover.
The likely scenario is that support will hold at the bottom of the trading range, which aligns with a long-term moving average that has provided support before. In this scenario, Target's stock price may wallow near current levels until more news is available. Because economic headwinds are expected to ease in 2025 and tailwinds to develop, Target’s business and stock price could begin to improve by the middle of next year.