
Tradeweb Markets Inc. (NASDAQ: TW) is a global developer and operator of electronic marketplaces, notably for bonds, ETFs, and derivatives. It's grown to become one of the leading electronic marketplaces for fixed-income trading. Traditionally, NASDAQ: MKTX">bond markets have been open outcry and specialist-run markets on a trading floor, but it has migrated to electronic trading due to its value proposition. Tradeweb has been a force in electrifying or democratizing fixed-income trading. The financial services sector company competes with exchanges like the Intercontinental Exchange Inc. (NYSE: ICE) and CME Group Inc. (NASDAQ: CME) along with electronic bond market platform operator MarketAxess Holdings Inc. (NASDAQ: MKTX).
Global bond markets
Regulated U.S. stock exchanges like the New York Stock Exchange or the NASDAQ are regulated to provide full transparency. By contrast, the global bond market is far less transparent. While government, municipal and corporate bonds have transparency and liquidity, more exotic bonds can be as transparent as I.O.U.s written on the back of a cocktail napkin. These are traded through analog means, including by phone, appointments, e-mail, or open outcry.
Migration to electronic marketplaces
The value proposition of electronic marketplaces can't be ignored. The speed, convenience, liquidity and transparency are all drivers that have moved traditional analog markets to electronic marketplaces. The days of open outcry auction-style trading floors have vaporized in the equity, futures, and commodities markets. The bond markets are also migrating to electronic exchanges, and Tradeweb is a major aggregator and beneficiary of this trend. This is evidenced by the total trading volumes reaching $42.6 trillion in January 2024.
Sheer volume growing
Average daily volume in January hit a record $2 trillion, up 75% YoY. Tradeweb reached new records for European government bonds, average daily volume (ADV) for U.S. government bonds, European credit, fully electronic U.S. high-grade credit, swaps and swaptions for one year and greater, and global repurchase agreements. Tradeweb also handles the clearing and settling of trades. Get AI-powered insights on MarketBeat.
Accelerating growth
On February 6, 2024, Tradeweb reported Q4 2023 EPS of 64 cents in-line with consensus analyst estimates. Revenues rose 26.3% YoY to $370 million versus $372.49 million. The company raised its dividend to 10 cents per share. Tradeweb expects full-year 2024 adjusted expenses between $755 million and $805 million. Revenues for its LSEG Market Data Contract are expected to be around $80 million.
Average daily trading volume growth
U.S. government bond ADV rose 34$ YoY to $182.1 billion. European government bond ADV grew 19.1% to $50.1 billion. Fully electronic U.S. credit ADV rose 45% to $7.1 billion, while European credit ADV grew 16% to $2.6 billion. Money market, repurchase agreement ADV grew 31% to $546.2 billion. Mortgage ADV rose 23.9% YoY to $219.5 billion. Swaps and swaptions 1 year or greater ADV rose 207.2% YoY to $590.8 billion, and total rates derivatives ADV spiked 194.2% YoY to $922.7 billion.
U.S. ETF ADV rose 41% YoY to $2.6 billion. Rates and credit accounted for 60% and 20% of revenue growth. Money markets hit a record thanks to growth in its retail certificate of deposit (CD) franchise and continued organic growth in institutional reports. The company integrated its NASDAQ fixed-income acquisitions.
Tradeweb CEO Billy Hult commented, "Looking ahead, the client pipeline remains strong as the benefits of our electronic solutions continue to resonate. We believe we are well positioned to capitalize on the long-term secular ETF growth story, not just in equities, but across our fixed income business."
Tradeweb Markets analyst ratings and price targets are at MarketBeat. Tradeweb Markets peers and competitor stocks can be found with the MarketBeat stock screener.
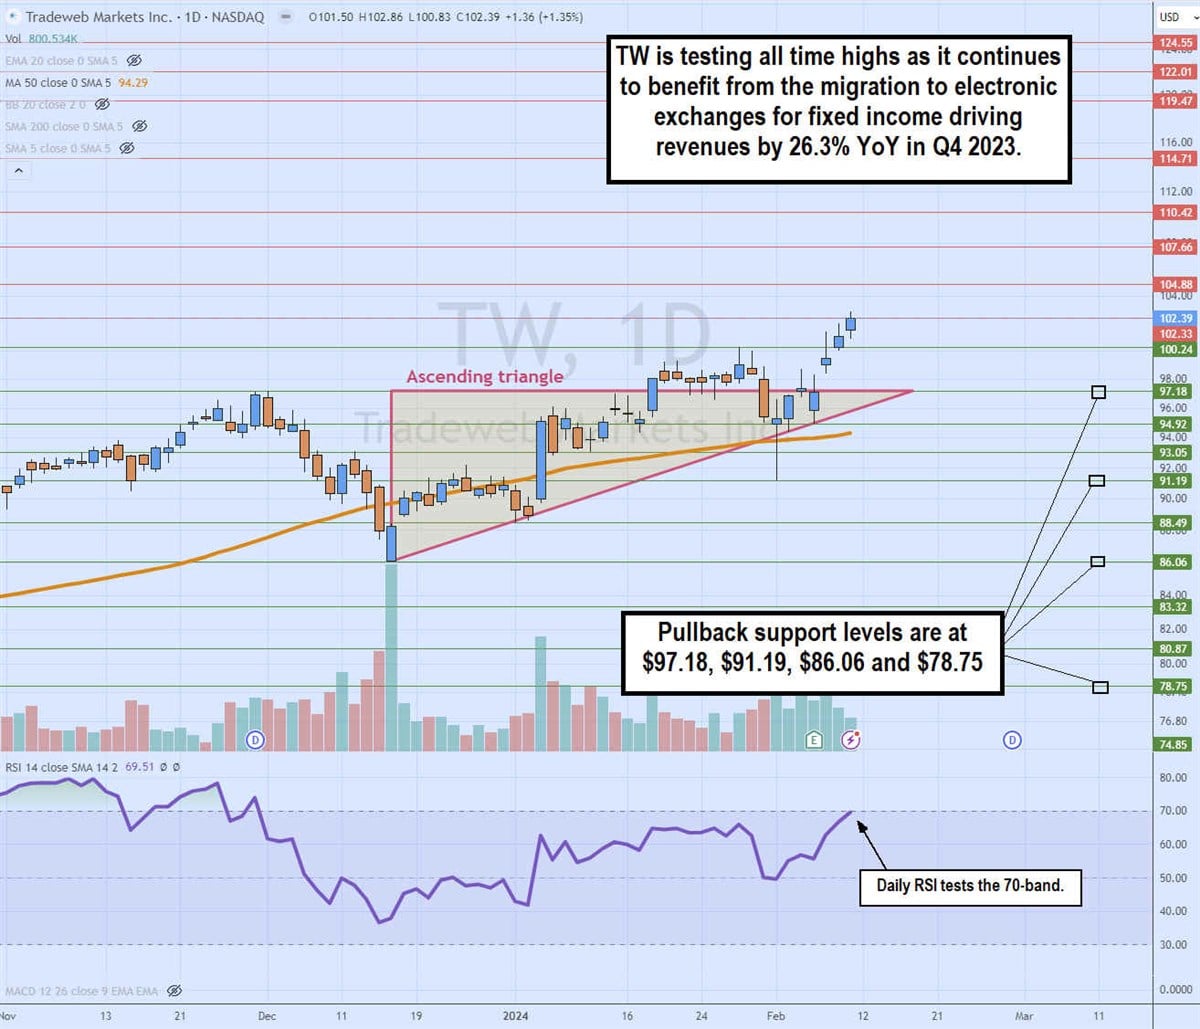
Ascending triangle breakout pattern
The daily candlestick chart for TW illustrates an ascending triangle breakout pattern. The ascending lower trendline formed at the $86.06 swing low on December 15, 2023. TW ground higher through the daily 50-period moving average resistance, which has now transformed into support at $94.29. The upper flat-top trendline at $97.18 attempted a breakout on January 18, 2024. Shares rose to a high of $100.24 but reversed back down into the triangle range after bouncing off $91.19. As TW got closer to the apex point, it formed a breakout again on its Q4 2023 earnings release which rocketed shares towards retesting its all-time highs at $102.33. The daily relative strength index (RSI) is rising to test the overbought 70-band. Pullback support levels are at $97.18, $91.19, $86.06 and $78.75.