
As the theme of 2023 continues into 2024, seeing technology stocks and, more specifically, semiconductor and AI names dominate the headlines, it might be easy to miss other promising setups in less-spoken sectors.
One sector that has quietly gained over 15% over the previous three months and consolidating near the high end of its 52-week range might surprise you. The retail sector, specifically its popular ETF, the SPDR S&P 500 Retail ETF (NYSE: XRT), is positive year-to-date and has increased significantly over the previous three months.
More so, the ETF is consolidating above its rising major moving averages in a bullish formation, suggesting the sector might be on the verge of a breakout. Notably, the top holding of the sector ETF just reported blowout earnings, which might increase the odds of a sector-wide breakout.
Let’s explore the ETF and its key holdings in more detail to better gauge the sentiment.
What is the XRT?
The SPDR S&P Retail ETF aims to mirror the S&P Retail Select Industry Index's performance, an equally weighted market cap index representing the retail sub-industry within the S&P Total Market Index. The ETF invests in various retail sectors, including apparel, automotive, food, department stores, online retail, general merchandise, drug retail, hypermarkets, and supercenters.
The ETF has $421 million in assets under management and offers a dividend yield of 1.77% and a net expense ratio of 0.35%. Its holdings' geographic exposure is predominantly in the United States, with a 98.5% exposure to the region. Regarding sector exposure, the ETF is mainly exposed to the Consumer Discretionary sector, with a 67% exposure.
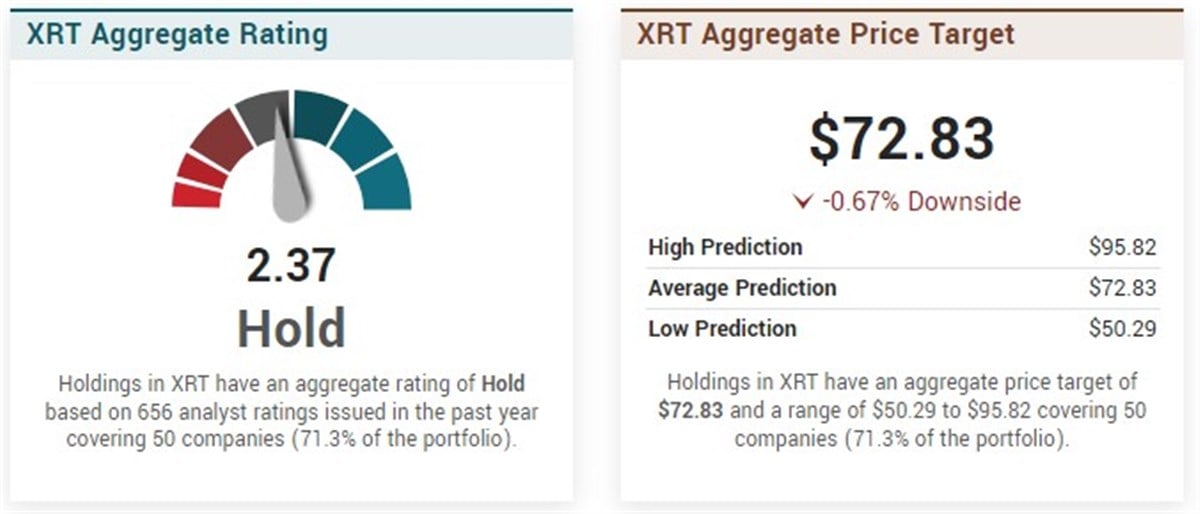
The XRT holds a Hold aggregate rating based on evaluations from 656 analysts covering around 71.3% of its portfolio across 50 companies. Looking at its price target, XRT is $72.83, which aligns with current prices. Analysts' predictions span from $ 50.29 to $95.82, considering the range of evaluations within the portfolio's 50 companies.
From a technical analysis point of view, $74 and $72 are the key areas to watch for the sector ETF, with the former acting as significant resistance and the latter as support. If the ETF can push above resistance and hold, a move toward its January 2023 high might be the likely outcome, near $76.
ETF’s top 3 holdings point to further upside
The ETF’s top holding is Carvana (NYSE: CVNA), with a weight of 3.21%. Year-to-date, the stock is up close to 20% after reporting record fourth quarter and full year 2023 results on Thursday afternoon. Its recent earnings beat and surge higher could lend a helping hand to the ETF, contributing positively to its overall performance. The sentiment remains overwhelmingly bearish on CVNA, with a reduce rating and price target forecasting over 30% of downside.
Its second top holding is Signet Jewelers (NYSE: SIG), with a 1.65% weighting. Year-to-date, the stock is down almost just over 2%. However, over three months, it is up an impressive 29%. With the stock trading near a significant inflection point, near $108, a move above resistance could spark a considerable momentum shift to the upside and help the overall sector push higher.
Kohl’s (NYSE: KSS) is the ETF’s third-largest holding, with a weighting of 1.62%. Year-to-date, the stock has slightly outperformed. Since the start of the year, KSS has risen almost 6% and just over 18% over the last three months. The stock has spent the last several months consolidating near a major breakout level, near $28. Similar to SIG, a move above this level could indicate a higher timeframe momentum shift and the beginning of a fresh uptrend for the stock. Given its weighting in the sector ETF, such a move could influence the performance of the overall sector.


