Casey’s General Store (NASDAQ: CASY) peaked ahead of its FQ3 release and is correcting afterward, but don’t think the sell-off will continue for long. The company’s results were tepid and mixed but revealed resiliency in a business model that has delivered value to shareholders for years. Takeaways from the results include flat revenue, better-than-expected profitability, cash flow, capital returns, and shareholder equity, which increased by 10%.
The operational quality and trends leading to these results have the stock up in the 1, 3, 5, 10, and 20-year comparisons and heading higher this year and next.
Casey’s Mixed Quarter: No Problem for Analysts
Casey’s had a mixed quarter with flat revenue missing the Marketbeat.com consensus estimate but margin, cash flow, and profits exceeding the mark. Revenue came in at $3.33 billion, flat YOY and 600 basis points short of the consensus, but this is the worst news. Revenue is driven by an increased store count and higher inside comp sales offset by lower fuel revenue.
Inside comps are up 4%, 9.1% in the two-year stack, on strength in grocery and prepared foods. Prepared foods advanced 7.5% on strength in beverages and sandwiches as consumers lean into the lower-priced offerings. Gas comps were down slightly, 0.4%, compounded by lower realized pricing.
Margin news is the brightest spot in the report. Inside margins were widened on sales strength and fewer hours worked, driving segment operating profits up by 11.3%. This was offset by a -2% decline in fuel profits and higher operating costs associated with more stores, leaving the GAAP earnings at $2.23. The $2.23 is down 13% YOY but $0.19 or 900 bps ahead of consensus, bolstering the capital return outlook and shareholder value.
Casey’s General Store Builds Value for Investors
The stock trades above the broad market average at 21X current year earnings, but you get more than average returns. The balance sheet highlights include reduced cash due to acquisitions offset by increased assets, reduced debt, and a 10% increase in shareholder equity. Cash flow is used to grow the business, repurchase shares and pay dividends, which are reliable if not robust.
Share repurchases in Q3 bring the YTD share count down by 0.6% and are expected to remain solid through year-end and next year. The company spent $30 million on repurchases in the quarter and has $310 million left under the authorization. Dividends aren’t robust at 0.6%yield but are incredibly safe at 14% of earnings and growing. The company has increased its distribution annually for 24 years and is on track to make another in FQ1.
Analysts Raise the Bar for Casey’s General Store
Analysts' activity following the Q3 release is mixed for Casey’s, but the takeaways are bullish. The high end of the range was lowered, and the bottom raised, narrowing the range, but there were more upward revisions than down, leaving the consensus higher than before the release and 5% above the current price action. Among those raising targets are Deutsche Bank, JPMorgan Chase & Co, and RBC, which have a three-way consensus of $306, aligning with the broader consensus. Consensus is up 7.5% following the release and will likely increase as the year progresses.
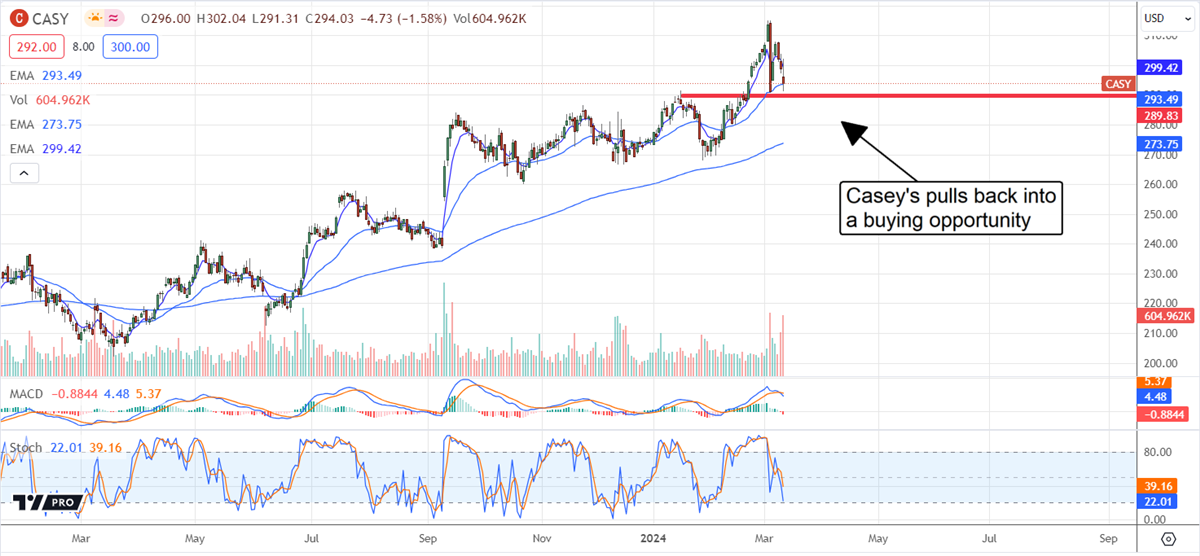
The technical outlook is good. This stock is in a long and sustained uptrend driven by its growth, operational quality, cash flow and dividends. The stock peaked ahead of the release and is pulling back now with potential for solid support near current levels. Assuming the market sustains support near $290, it should rebound soon and set new highs by mid-year. If not, this stock could pull back to the long-term EMA near $280 before rebounding and continuing its uptrend.