Micron Technology Inc. (NASDAQ: MU) is synonymous with memory chips, just as Nvidia Co. (NASDAQ: NVDA) is synonymous with NASDAQ: AAPL">artificial intelligence (AI). They are the leading manufacturer of dynamic random access memory (DRAM) and NAND flash memory. The computer and technology sector leader is a gauge of the health of the memory chip market. Its recent earnings blowout signals two developments in the memory chip market.
The trough may be over in the memory chip market, and AI is driving the insatiable demand for data storage. Micron stands to benefit directly from the NASDAQ: MSFT">AI boom for years to come as it presents a secular trend with a long runway.
From a Basement to Number 3 Worldwide
Micron Technology started as a 4 person semiconductor design company in 1978 in Boise, Idaho, in the basement of a dental office. The company has since evolved as a pioneer with over 50,000 patents related to memory chip design and manufacturing with over 43,000 employees worldwide. In 2023,
Micron has become the third largest supplier of DRAM chips in the world, with a 23% market share, generating over $15 billion in annual revenues in 2023. Its largest clients read like a who's who of the technology world, including Hewlett Packard Enterprise Co. (NYSE: HPE) and Dell Technologies Inc. (NYSE: DELL) in the AI server segment, Apple Inc. (NASDAQ: AAPL) in the mobile segment and Amazon.com Inc. (NASDAQ: AMZN), Microsoft Co. (NASDAQ: MSFT) and Alphabet Inc. (NASDAQ: GOOGL) in the NASDAQ: GOOGL">cloud and data center segment.
Volatile vs. Nonvolatile Memory
With memory chips, there are two distinct types. DRAM chips can only save data when the computing device’s power is turned on. It’s considered ‘working memory, which makes it temporary. Data is no longer saved when the device is turned off. DRAM is commonly found in tablets, notebooks, desktop computers and smartphones.
NAND Flash memory is a nonvolatile memory that retains and saves data even when the device’s power is turned off. It is commonly used in flash storage devices like solid state drives (SSD), USB flash drives and memory cards. Check out the sector heatmap on MarketBeat.
HBM3E is the Game Changer for Micron
Micron's breakthrough high-performance memory solution is High Bandwidth Memory 3E (HBM3E). It delivers over 9.2 Gps per pin with over 1.2 TB/s per stack. It's available in 8-high and 12-high stacks, which offer capacities of 24 GB and 36 GB, respectively.
Micron Knocks it Out of the Park.
On March 20, 2024, Micron Technology reported fiscal Q2 2024 EPS of 42 cents, beating consensus analyst estimates for a loss of 25 cents by 67 cents. GAAP net income was $793 million or 71 cents per diluted share. Non-GAAP income was $476 million or 42 cents per diluted share. Revenues surged 57.7% YoY to $5.82 billion, beating $5.35 billion consensus estimates. Operating cash flow was $1.22 billion, versus $1.40 billion in the prior quarter and $343 million for the year-ago quarter. Non-GAAP gross margin was 20%, up significantly from 0.8% in fiscal Q1 2024.
Knock Out Metrics
Its DRAM segment generated $4.2 billion and 71% of total revenue. The average selling price rose by high teens QoQ. Revenues grew 21% QoQ.
NAND revenues rose to $1.6 billion, representing 27% of total revenues and increased QoQ. ASPs for NAND rose 30% QoQ. HBM3E is already sold out for calendar year 2024 and 2025 supply has already been allocated.
Big Guidance Raise
Micron issued upside guidance for fiscal Q3 2024 EPS of 45 cents +/- 7 cents or a range between 38 cents to 52 cents versus 9 cents consensus estimates. Non-GAAP gross margins are expected +/- 1.5% of 26.5%. Revenues are expected between $6.4 billion to $6.8 billion versus $6 billion consensus estimates.
Micron Technology CEO Sanjay Mehrotra commented, “Our preeminent product portfolio positions us well to deliver a strong fiscal second half of 2024. We believe Micron is one of the biggest beneficiaries in the semiconductor industry of the multi-year opportunity enabled by AI.”
Micron Technology analyst ratings and price targets are at MarketBeat. Micron Technology’s peers and competitor stocks can be found with the MarketBeat stock screener.
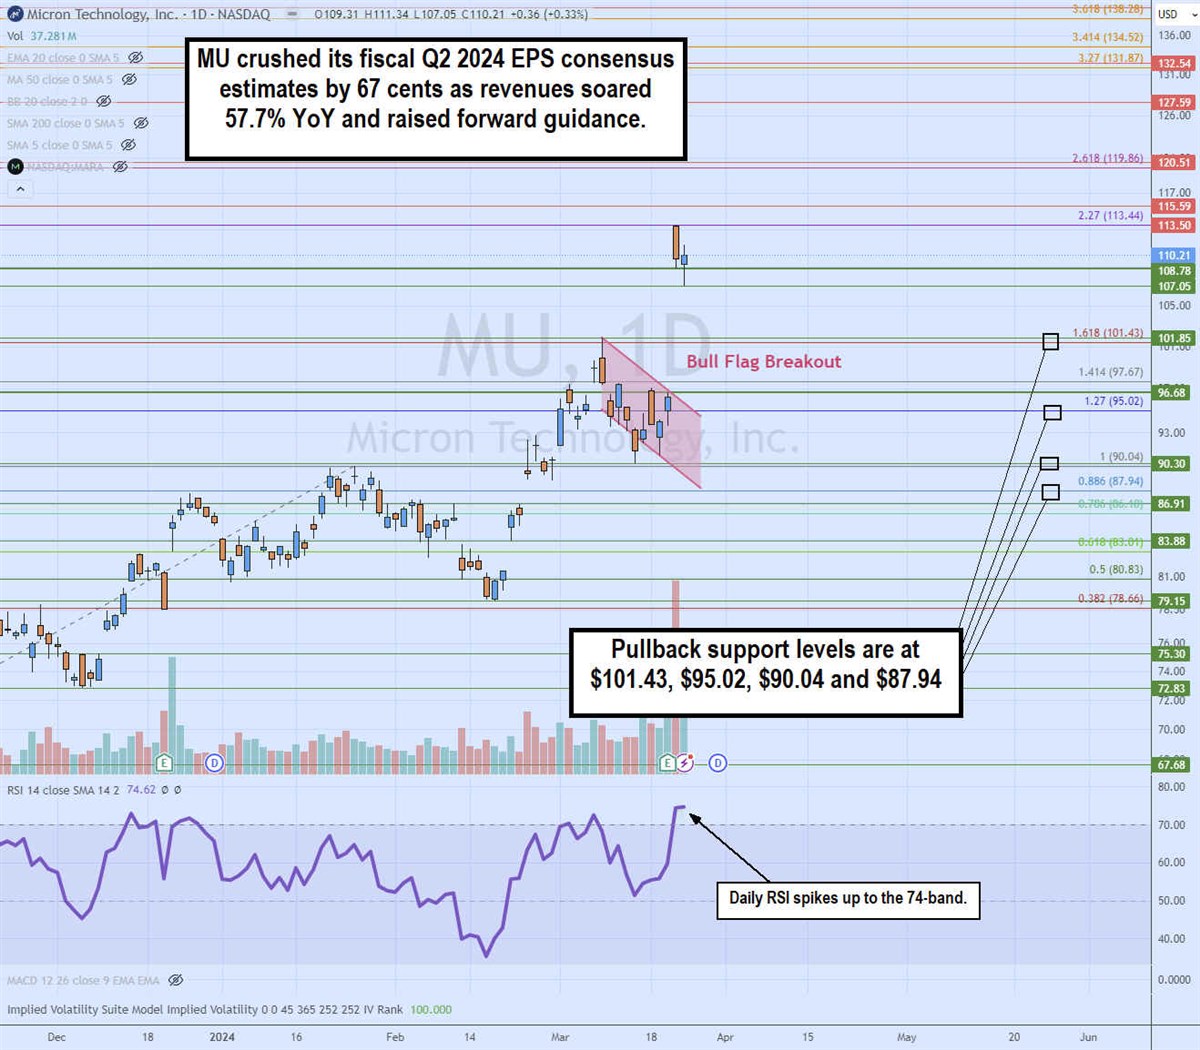
Daily Bull Flag Breakout
The daily candlestick chart for MU illustrates a bull flag breakout pattern to all-time highs on its fiscal Q2 2024 earnings report. The flag formed near the 1.68 Fibonacci extension on March 8, 2024. MU pulled back in a parallel channel until its earnings release, which triggered a gap to $108.78 as shares surged more than 14%.
The daily relative strength index (RSI) soared to 74-band as shares attempted to hold a new base over $100. Pullback support levels are at $101.43, $95.02, $90.04 and $87.94.