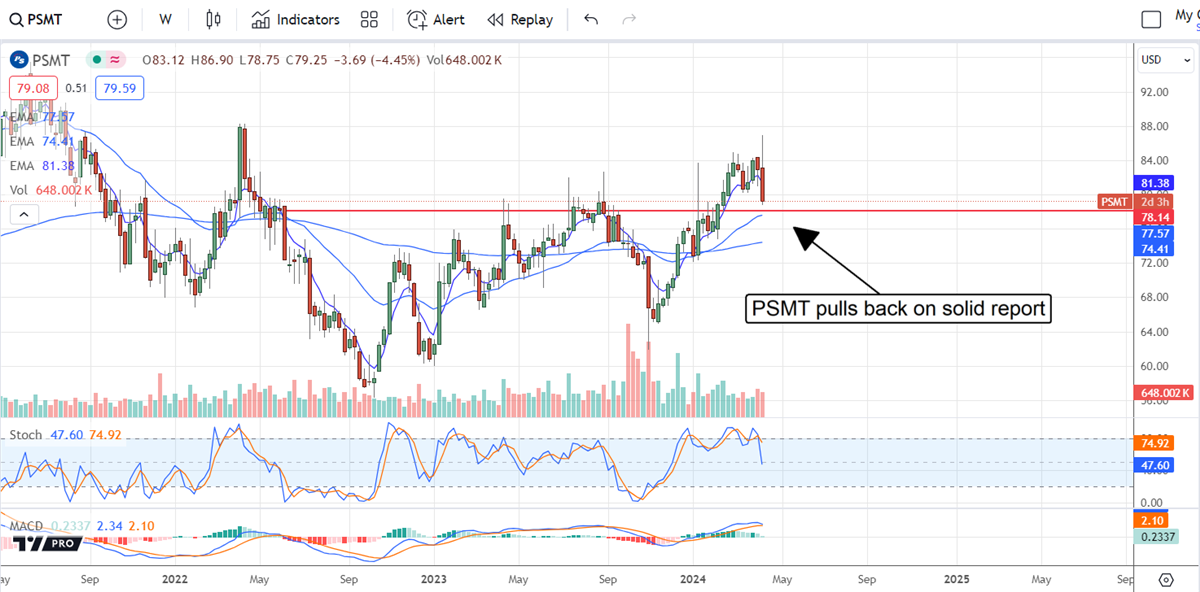
 PriceSmart's (NASDAQ: PSMT) shares soared on the Q2 results and outlook but did not hold the gains. As ominous as the candle is, the pullback is an attractive entry point that may be among the smartest buys of the year. Nothing in the report signals weakness or diminishing value, and extenuating circumstances exist. The CPI for March was released soon after the report and left the entire stock market moving lower. Because PriceSmart is less heavily traded, with less than one million shares exchanged on average daily, its price pullback was amplified.
Among the details that investors should cheer about is the special dividend. The board approved a special dividend because of excess cash and nearly doubled the annual payout. The regular dividend is worth 1.4% annually, the special $1 payout is worth another 1.25%, and business is only improving. The special dividend is payable to shareholders of record on April 19.
PriceSmart Has Industry-Leading Growth
PriceSmart had a solid quarter in Q2, producing $1.29 billion in net revenue. The gains are industry-leading at 13.2% and outpaced the Marketbeat-reported consensus by 100nps. Costco, the world's largest membership club, grew by only 5% in its last report. PriceSmart's growth is driven by an 8.8% comp store gain compounded by a new store count and an FX tailwind. The company added four new stores during the quarter; FX added another 360bps to the growth.
The membership data is impressive. The company reports an 8% increase in store count growth that only partially accounts for the 14% increase in membership. The takeaway is that PriceSmart continues to gain leverage in existing markets by deepening the penetration of markets and services offered while growing the store count base. The plan is to open a 55th store by next year, increasing the footprint in Costa Rica, the largest market.
Margin news is mixed. The GAAP margin improved significantly to drive net income up by 25%, but adjusted results are less robust. The adjusted margin contracted marginally to leave earnings up but only 500bps compared to the double-digit top-line growth. Regardless, cash flow is solid, leaving the business in healthy shape and able to pay the special dividend.
Balance sheet highlights from Q2 include a reduction in cash offset by receivables and inventory and a reduction in long-term debt offset by the special dividend. The net result is flat shareholder equity and incredibly low leverage ratios. The company’s total liability to equity and long-term debt-to-equity ratios are below 1x, debt-to-equity is near 0.1x, and in fortress condition.
The Sell-Side Likes PriceSmart, but Analysts Aren’t Interested
Marketbeat tracks only two analysts with coverage on PriceSmart, a small figure aligning with the low-volume market. However, those analysts rate the stock as a Buy and see it trading at $82, which is significant because they agree it is worth $82 and undervalued. The rating and target are insufficient to get the stock to move higher but signal an opportunity. Analysts may begin to warm to this name and drive it higher.
PriceSmart stock trades at only 18x earnings while outperforming peers Walmart and Costco, which trade at 25x and 45x. It's doubtful PriceSmart will advance to 45x earnings, but even a low single-digit multiple expansion is worth significant upside for investors. Among the potential catalysts are the dividend, the outlook for regular distribution growth and future special dividends.
The Technical Outlook for PSMT Stock Is Higher Prices
The action in PSMT surged following the release, but the combination of profit-taking and bad economic news put a cap on the market, leading to a reversal. The candle is large and red, which may lead to lower prices, but the market is still above critical support. Critical support is near $78 and potentially strong. Institutional activity increased significantly in Q4 2023 when the price action was down and may do so again. In that scenario, PSMT should begin to bottom and rebound soon.