 ASML (NASDAQ: ASML) struggled in Q1 and has a warning for semiconductor investors. The warning is that new orders were less strong than hoped and undercut the semiconductor industry's outlook. A sizeable portion of new orders included the cutting-edge EUV technology, but not enough to support the inflated outlook driven by AI.
This means that chipmakers' results could be weaker than expected going forward and worse; guidance may also be weak and lead the tech sector into a deep depression. Shares of stocks like AMD (NASDAQ: AMD) and NVIDIA (NASDAQ: NVDA) are down from their peaks but still up substantially for the year and from last year’s lows, leaving them in a precarious position. Names like Intel (NASDAQ: INTC), Taiwan Semiconductor (NYSE: TSM), and Samsung (OTCMKTS: SSNLF), which are more closely tied to ASMLs business, are also set up to extend their recent declines.
ASML Has Weak Quarter But Reaffirms Guidance
ASML had a weak quarter in Q1, with revenue falling 21% compared to last year due to new and used equipment weakness. New equipment sales fell 42%, while used equipment sales fell 64%. The guidance for Q2 is decent, with sequential growth expected, but the net bookings offset the impact. Net bookings fell 60% sequentially, suggesting caution among the chipmakers.
The margin is decent and held steady compared to last year. The gross margin fell 40 basis points but less than expected to drive better-than-expected bottom-line results. The GAAP $3.31 outpaced the consensus by $0.40 but may not be directly comparable due to FX translation. The results were solid enough to sustain the dividend and dividend growth. The board announced the final payment for 2023 which converts to $1.86 with the EUR/USD at $1.06.
Guidance is also decent, but expects a significant pivot in the back half of the year that may not come. Q2 revenue should accelerate to the range of $6.07 to $6.6 billion, with significantly stronger results in the back half. The full-year outlook was reaffirmed at flat compared to last year, with caution that this is a transition year. The business expects to resume growth in 2025, driven by next-gen and AI technologies supported by the CHIPs Act (in the US) and demand globally.
[content-module:CompanyOverview|NASDAQ: ASML]
ASML Capital Returns Will Continue to Flow
ASML’s dividend yield is not large, and the payouts can be erratic due to the distribution policy, but the payment is safe and reliable. The company pays less than 35% of its earnings and maintains a fortress balance sheet.
Balance sheet highlights from Q1 include a reduction in cash and assets offset by lower debt and liabilities, resulting in increased shareholder equity. Leverage is less than 0.35X equity, total liabilities are less than 2X equities and cash is about 5X. The cash flow and balance sheet allow for share repurchases, but there is a catch. Repurchases did not offset dilutive actions over the past year, and the share count is rising.
Analysts support this market but may cap upward momentum now that results and guidance are in. The trend in 2024 is positive, including numerous price target increases, upgrades, and initiated coverages, but may have overestimated the timing of the foundry-market recovery. The consensus is up 33% compared to last year and predicts a 5% upside from the pre-release action, about 10% with the post-release decline, but it is unlikely to rise further.
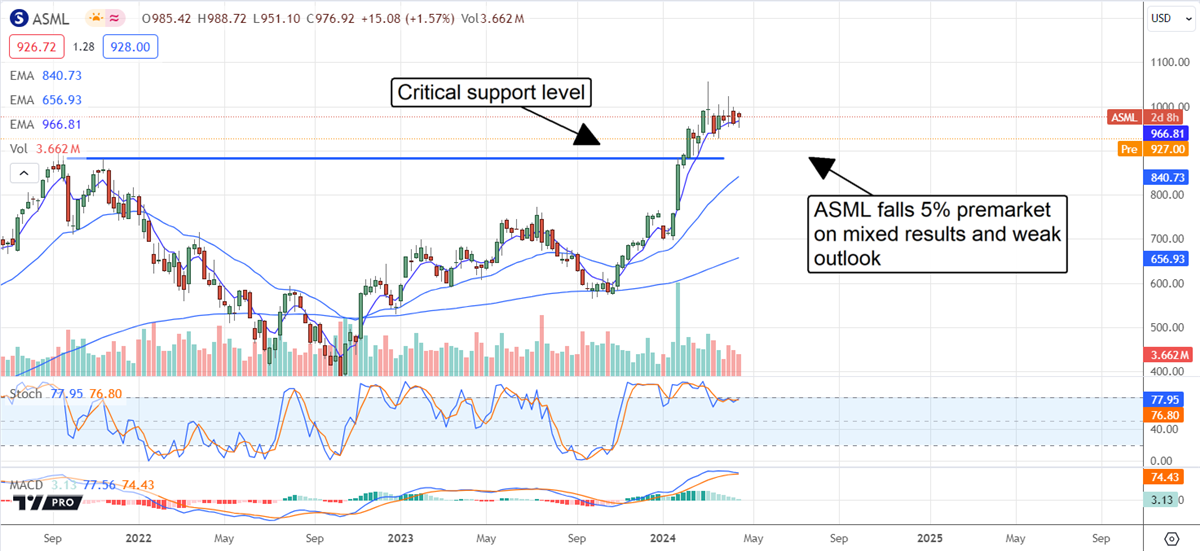
ASML Struggles With Resistance: A Deeper Decline is Possible
Shares of ASML fell 5% in premarket trading following the Q1 release. The move confirms that resistance at the recent highs is strong and has the market set up to reverse. Critical support is near previous highs at $885 and may be tested soon. If support does not hold at this level, the market could fall to $800 or lower. Such a move would create a value opportunity in this market and set up a buying opportunity; the question is when the rebound in equipment sales will gain traction.